Quantcast
Channel: Rick Strahl's Web Log
Viewing all 665 articles
Browse latest View live

Creating ASP.NET MVC Negotiated Content Results

$
0
0

In a recent ASP.NET MVC application I’m involved with, we had a late in the process request to handle Content Negotiation: Returning output based on the HTTP Accept header of the incoming HTTP request. This is standard behavior in ASP.NET Web API but ASP.NET MVC doesn’t support this functionality directly out of the box.

Another reason this came up in discussion is last week’s announcements of ASP.NET vNext, which seems to indicate that ASP.NET Web API is not going to be ported to the cloud version of vNext, but rather be replaced by a combined version of MVC and Web API. While it’s not clear what new API features will show up in this new framework, it’s pretty clear that the ASP.NET MVC style syntax will be the new standard for all the new combined HTTP processing framework.

Why negotiated Content?

Content negotiation is one of the key features of Web API even though it’s such a relatively simple thing. But it’s also something that’s missing in MVC and once you get used to automatically having your content returned based on Accept headers it’s hard to go back to manually having to create separate methods for different output types as you’ve had to with Microsoft server technologies all along (yes, yes I know other frameworks – including my own – have done this for years but for in the box features this is relatively new from Web API).

As a quick review,  Accept Header content negotiation works off the request’s HTTP Accept header:

POST http://localhost/mydailydosha/Editable/NegotiateContent HTTP/1.1
Content-Type: application/jsonAccept: application/json
Host: localhost
Content-Length: 76
Pragma: no-cache

{ ElementId: "header", PageName: "TestPage", Text: "This is a nice header" }

If I make this request I would expect to get back a JSON result based on my application/json Accept header. To request XML  I‘d just change the accept header:

Accept: text/xml

and now I’d expect the response to come back as XML. Now this only works with media types that the server can process. In my case here I need to handle JSON, XML, HTML (using Views) and Plain Text. HTML results might need more than just a data return – you also probably need to specify a View to render the data into either by specifying the view explicitly or by using some sort of convention that can automatically locate a view to match. Today ASP.NET MVC doesn’t support this sort of automatic content switching out of the box.

Unfortunately, in my application scenario we have an application that started out primarily with an AJAX backend that was implemented with JSON only. So there are lots of JSON results like this:

[Route("Customers")]public ActionResult GetCustomers()
{return Json(repo.GetCustomers(),JsonRequestBehavior.AllowGet);
}

These work fine, but they are of course JSON specific. Then a couple of weeks ago, a requirement came in that an old desktop application needs to also consume this API and it has to use XML to do it because there’s no JSON parser available for it. Ooops – stuck with JSON in this case.

While it would have been easy to add XML specific methods I figured it’s easier to add basic content negotiation. And that’s what I show in this post.

Missteps – IResultFilter, IActionFilter

My first attempt at this was to use IResultFilter or IActionFilterwhich look like they would be ideal to modify result content after it’s been generated using OnResultExecuted() or OnActionExecuted().Filters are great because they can look globally at all controller methods or individual methods that are marked up with the Filter’s attribute. But it turns out these filters don’t work for raw POCO result values from Action methods.

What we wanted to do for API calls is get back to using plain .NET types as results rather than result actions. That is  you write a method that doesn’t return an ActionResult, but a standard .NET type like this:

public Customer UpdateCustomer(Customer cust) {… do stuff to customer :-)

return cust; }

Unfortunately both OnResultExecuted and OnActionExecuted receive an MVC ContentResultinstance from the POCO object. MVC basically takes any non-ActionResult return value and turns it into a ContentResult by converting the value using .ToString(). Ugh. The ContentResult itself doesn’t contain the original value, which is lost AFAIK with no way to retrieve it. So there’s no way to access the raw customer object in the example above. Bummer.

Creating a NegotiatedResult

This leaves mucking around with custom ActionResults. ActionResults are MVC’s standard way to return action method results – you basically specify that you would like to render your result in a specific format. Common ActionResults are ViewResults (ie. View(vn,model)), JsonResult, RedirectResult etc. They work and are fairly effective and work fairly well for testing as well as it’s the ‘standard’ interface to return results from actions. The problem with the this is mainly that you’re explicitly saying that you want a specific result output type. This works well for many things, but sometimes you do want your result to be negotiated.

My first crack at this solution here is to create a simple ActionResult subclass that looks at the Accept header and based on that writes the output. I need to support JSON and XML content and HTML as well as text – so effectively 4 media types: application/json, text/xml, text/html and text/plain. Everything else is passed through as ContentResult – which effecively returns whatever .ToString() returns.

Here’s what the NegotiatedResult usage looks like:

public ActionResult GetCustomers()
{return new NegotiatedResult(repo.GetCustomers());
}public ActionResult GetCustomer(int id)
{return new NegotiatedResult("Show", repo.GetCustomer(id));
}

There are two overloads of this method – one that returns just the raw result value and a second version that accepts an optional view name. The second version returns the Razor view specified only if text/html is requested – otherwise the raw data is returned. This is useful in applications where you have an HTML front end that can also double as an API interface endpoint that’s using the same model data you send to the View. For the application I mentioned above this was another actual use-case we needed to address so this was a welcome side effect of creating a custom ActionResult.

There’s also an extension method that directly attaches a Negotiated() method to the controller using the same syntax:

public ActionResult GetCustomers()
{return this.Negotiated(repo.GetCustomers());
}public ActionResult GetCustomer(int id)
{return this.Negotiated("Show",repo.GetCustomer(id));
}

Using either of these mechanisms now allows you to return JSON, XML, HTML or plain text results depending on the Accept header sent. Send application/json you get just the Customer JSON data. Ditto for text/xml and XML data. Pass text/html for the Accept header and the "Show.cshtml" Razor view is rendered passing the result model data producing final HTML output.

While this isn’t as clean as passing just POCO objects back as I had intended originally, this approach fits better with how MVC action methods are intended to be used and we get the bonus of being able to specify a View to render (optionally) for HTML.

How does it work

An ActionResult implementation is pretty straightforward. You inherit from ActionResult and implement the ExecuteResult method to send your output to the ASP.NET output stream. ActionFilters are an easy way to effectively do post processing on ASP.NET MVC controller actions just before the content is sent to the output stream, assuming your specific action result was used.

Here’s the full code to the NegotiatedResult class (you can also check it out on GitHub):

/// <summary>
/// Returns a content negotiated result based on the Accept header./// Minimal implementation that works with JSON and XML content,/// can also optionally return a view with HTML.    /// </summary>
/// <example>
/// // model data only/// public ActionResult GetCustomers()/// {///      return new NegotiatedResult(repo.Customers.OrderBy( c=> c.Company) )/// }/// // optional view for HTML/// public ActionResult GetCustomers()/// {///      return new NegotiatedResult("List", repo.Customers.OrderBy( c=> c.Company) )/// }/// </example>public class NegotiatedResult : ActionResult{/// <summary>
    /// Data stored to be 'serialized'. Public/// so it's potentially accessible in filters./// </summary>public object Data { get; set; }/// <summary>
    /// Optional name of the HTML view to be rendered/// for HTML responses/// </summary>public string ViewName { get; set; }public static bool FormatOutput { get; set; }static NegotiatedResult()
    {
        FormatOutput = HttpContext.Current.IsDebuggingEnabled;
    }/// <summary>
    /// Pass in data to serialize/// </summary>
    /// <param name="data">Data to serialize</param>        public NegotiatedResult(object data)
    {
        Data = data;
    }/// <summary>
    /// Pass in data and an optional view for HTML views/// </summary>
    /// <param name="data"></param>
    /// <param name="viewName"></param>public NegotiatedResult(string viewName, object data)
    {
        Data = data;
        ViewName = viewName;
    }public override void ExecuteResult(ControllerContext context)
    {if (context == null)throw new ArgumentNullException("context");HttpResponseBase response = context.HttpContext.Response;HttpRequestBase request = context.HttpContext.Request;// Look for specific content types            if (request.AcceptTypes.Contains("text/html"))
        {
            response.ContentType = "text/html";if (!string.IsNullOrEmpty(ViewName))
            {var viewData = context.Controller.ViewData;
                viewData.Model = Data;var viewResult = new ViewResult{
                    ViewName = ViewName,
                    MasterName = null,
                    ViewData = viewData,
                    TempData = context.Controller.TempData,
                    ViewEngineCollection = ((Controller)context.Controller).ViewEngineCollection
                };
                viewResult.ExecuteResult(context.Controller.ControllerContext);
            }elseresponse.Write(Data);
        }else if (request.AcceptTypes.Contains("text/plain"))
        {
            response.ContentType = "text/plain";
            response.Write(Data);
        }else if (request.AcceptTypes.Contains("application/json"))
        {using (JsonTextWriter writer = new JsonTextWriter(response.Output))
            {var settings = new JsonSerializerSettings();if (FormatOutput)
                    settings.Formatting = Newtonsoft.Json.Formatting.Indented;JsonSerializer serializer = JsonSerializer.Create(settings);

                serializer.Serialize(writer, Data);
                writer.Flush();
            }
        }
        else if (request.AcceptTypes.Contains("text/xml"))
        {
            response.ContentType = "text/xml";if (Data != null)
            {using (var writer = new XmlTextWriter(response.OutputStream, new UTF8Encoding()))
                {if (FormatOutput)
                        writer.Formatting = System.Xml.Formatting.Indented;XmlSerializer serializer = new XmlSerializer(Data.GetType());

                    serializer.Serialize(writer, Data);
                    writer.Flush();
                }
            }
        }
        else{// just write data as a plain stringresponse.Write(Data);
        }
    }
}/// <summary>
/// Extends Controller with Negotiated() ActionResult that does/// basic content negotiation based on the Accept header./// </summary>public static class NegotiatedResultExtensions{/// <summary>
    /// Return content-negotiated content of the data based on Accept header./// Supports:///    application/json  - using JSON.NET///    text/xml   - Xml as XmlSerializer XML///    text/html  - as text, or an optional View///    text/plain - as text/// </summary>        
    /// <param name="controller"></param>
    /// <param name="data">Data to return</param>
    /// <returns>serialized data</returns>
    /// <example>
    /// public ActionResult GetCustomers()/// {///      return this.Negotiated( repo.Customers.OrderBy( c=> c.Company) )/// }/// </example>public static NegotiatedResult Negotiated(this Controller controller, object data)
    {return new NegotiatedResult(data);
    }/// <summary>
    /// Return content-negotiated content of the data based on Accept header./// Supports:///    application/json  - using JSON.NET///    text/xml   - Xml as XmlSerializer XML///    text/html  - as text, or an optional View///    text/plain - as text/// </summary>        
    /// <param name="controller"></param>
    /// <param name="viewName">Name of the View to when Accept is text/html</param>
    /// /// <param name="data">Data to return</param>        
    /// <returns>serialized data</returns>
    /// <example>
    /// public ActionResult GetCustomers()/// {///      return this.Negotiated("List", repo.Customers.OrderBy( c=> c.Company) )/// }/// </example>public static NegotiatedResult Negotiated(this Controller controller, string viewName, object data)
    {return new NegotiatedResult(viewName, data);
    }
}

Output Generation – JSON and XML

Generating output for XML and JSON is simple – you use the desired serializer and off you go. Using XmlSerializer and JSON.NET it’s just a handful of lines each to generate serialized output directly into the HTTP output stream.

Please note this implementation uses JSON.NET for its JSON generation rather than the default JavaScriptSerializer that MVC uses which I feel is an additional bonus to implementing this custom action. I’d already been using a custom JsonNetResult class previously, but now this is just rolled into this custom ActionResult.

Just keep in mind that JSON.NET outputs slightly different JSON for certain things like collections for example, so behavior may change. One addition to this implementation might be a flag to allow switching the JSON serializer.

Html View Generation

Html View generation actually turned out to be easier than anticipated. Initially I used my generic ASP.NET ViewRenderer Class that can render MVC views from any ASP.NET application. However it turns out since we are executing inside of an active MVC request there’s an easier way: We can simply create a custom ViewResult and populate its members and then execute it.

The code in text/html handling code that renders the view is simply this:

response.ContentType = "text/html";if (!string.IsNullOrEmpty(ViewName))
{var viewData = context.Controller.ViewData;
    viewData.Model = Data;var viewResult = new ViewResult{
        ViewName = ViewName,
        MasterName = null,
        ViewData = viewData,
        TempData = context.Controller.TempData,
        ViewEngineCollection = ((Controller)context.Controller).ViewEngineCollection
    };
    viewResult.ExecuteResult(context.Controller.ControllerContext);
}elseresponse.Write(Data);

which is a neat and easy way to render a Razor view assuming you have an active controller that’s ready for rendering. Sweet – dependency removed which makes this class self-contained without any external dependencies other than JSON.NET.

Summary

While this isn’t exactly a new topic, it’s the first time I’ve actually delved into this with MVC. I’ve been doing content negotiation with Web API and prior to that with my REST library. This is the first time it’s come up as an issue in MVC. But as I have worked through this I find that having a way to specify both HTML Views *and* JSON and XML results from a single controller certainly is appealing to me in many situations as we are in this particular application returning identical data models for each of these operations.

Rendering content negotiated views is something that I hope ASP.NET vNext will provide natively in the combined MVC and WebAPI model, but we’ll see how this actually will be implemented. In the meantime having a custom ActionResult that provides this functionality is a workable and easily adaptable way of handling this going forward. Whatever ends up happening in ASP.NET vNext the abstraction can probably be changed to support the native features of the future.

Anyway I hope some of you found this useful if not for direct integration then as insight into some of the rendering logic that MVC uses to get output into the HTTP stream…

Related Resources

© Rick Strahl, West Wind Technologies, 2005-2014
Posted in MVC  ASP.NET  HTTP  

AngularJs ng-cloak Problems on large Pages

$
0
0

cloakedI’ve been working on a rather complex and large Angular page. Unlike a typical AngularJs SPA style ‘application’ this particular page is just that: a single page with a large amount of data on it that has to be visible all at once. The problem is that when this large page loads it flickers and displays template markup briefly before kicking into its actual content rendering. This is is what the Angular ng-cloak is supposed to address, but in this case I had no luck getting it to work properly.

This application is a shop floor app where workers need to see all related information in one big screen view, so some of the benefits of Angular’s routing and view swapping features couldn’t be applied. Instead, we decided to have one very big view but lots of ng-controllers and directives to break out the logic for code separation. For code separation this works great – there are a number of small controllers that deal with their own individual and isolated application concerns.

For HTML separation we used partial ASP.NET MVC Razor Views which made breaking out the HTML into manageable pieces super easy and made migration of this page from a previous server side Razor page much easier. We were also able to leverage most of our server side localization without a lot of  changes as a bonus. But as a result of this choice the initial HTML document that loads is rather large – even without any data loaded into it, resulting in a fairly large DOM tree that Angular must manage.

Large Page and Angular Startup

The problem on this particular page is that there’s quite a bit of markup – 35k’s worth of markup without any data loaded, in fact. It’s a large HTML page with a complex DOM tree. There are quite a lot of Angular {{ }} markup expressions in the document.

Angular provides the ng-cloak directive to try and hide the element it cloaks so that you don’t see the flash of these markup expressions when the page initially loads before Angular has a chance to render the data into the markup expressions.

<div id="mainContainer" class="mainContainer boxshadow"ng-app="app" ng-cloak>

Note the ng-cloak attribute on this element, which here is an outer wrapper element of the most of this large page’s content. ng-cloak is supposed to prevent displaying the content below it, until Angular has taken control and is ready to render the data into the templates.

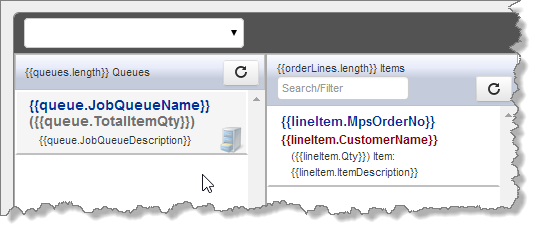
Alas, with this large page the end result unfortunately is a brief flicker of un-rendered markup which looks like this:

Unrendered

It’s brief, but plenty ugly – right?  And depending on the speed of the machine this flash gets more noticeable with slow machines that take longer to process the initial HTML DOM.

ng-cloak Styles

ng-cloak works by temporarily hiding the marked up element and it does this by essentially applying a style that does this:

[ng\:cloak], [ng-cloak], [data-ng-cloak], [x-ng-cloak], .ng-cloak, .x-ng-cloak {display: none !important;
}

This style is inlined as part of AngularJs itself. If you looking at the angular.js source file you’ll find this at the very end of the file:

!angular.$$csp() && angular.element(document)
.find(
'head')
.prepend(
'<style type="text/css">@charset "UTF-8";[ng\\:cloak],[ng-cloak],' +
'
[data-ng-cloak],[x-ng-cloak],.ng-cloak,.x-ng-cloak,' +
'.ng-hide{display:none !important;}ng\\:form{display:block;}'
'.ng-animate-block-transitions{transition:0s all!important;-webkit-transition:0s all!important;}' +
'</style>'
);

This is is meant to initially hide any elements that contain the ng-cloak attribute or one of the other Angular directive permutation markup. Unfortunately on this particular web page ng-cloak had no effect – I still see the flicker.

Why doesn’t ng-cloak work?

The problem is of course – timing. The problem is that Angular actually needs to get control of the page before it ever starts doing anything like process even the ng-cloak attribute (or style etc). Because this page is rather large (about 35k of non-data HTML) it takes a while for the DOM to actually plow through the HTML. With the Angular <script> tag defined at the bottom of the page after the HTML DOM content there’s a slight delay which causes the flicker.

For smaller pages the initial DOM load/parse cycle is so fast that the markup never shows, but with larger content pages it may show and become an annoying problem.

Workarounds

There a number of simple ways around this issue and some of them are hinted on in the Angular documentation.

Load Angular Sooner

One obvious thing that would help with this is to load Angular at the top of the page  BEFORE the DOM loads and that would give it much earlier control. The old ng-cloak documentation actually recommended putting the Angular.js script into the header of the page (apparently this was recently removed), but generally it’s not a good practice to load scripts in the header for page load performance. This is especially true if you load other libraries like jQuery which should be loaded prior to loading Angular so it can use jQuery rather than its own jqLite subset. This is not something I normally would like to do and also something that I’d likely forget in the future and end up right back here :-).

Use ng-include for Child Content

Angular supports nesting of child templates via the ng-include directive which essentially delay loads HTML content. This helps by removing a lot of the template content out of the main page and so getting control to Angular a lot sooner in order to hide the markup template content.

In the application in question, I realize that in hindsight it might have been smarter to break this page out with client side ng-include directives instead of MVC Razor partial views we used to break up the page sections. Razor partial views give that nice separation as well, but in the end Razor puts humpty dumpty (ie. the HTML) back together into a whole single and rather large HTML document. Razor provides the logical separation, but still results in a large physical result document.

But Razor also ended up being helpful to have a few security related blocks handled via server side template logic that simply excludes certain parts of the UI the user is not allowed to see – something that you can’t really do with client side exclusion like ng-hide/ng-show – client side content is always there whereas on the server side you can simply not send it to the client.

Another reason I’m not a huge fan of ng-include is that it adds another HTTP hit to a request as templates are loaded from the server dynamically as needed. Given that this page was already heavy with resources adding another 10 separate ng-include directives wouldn’t be beneficial :-)

ng-include is a valid option if you start from scratch and partition your logic. Of course if you don’t have complex pages, having completely separate views that are swapped in as they are accessed are even better, but we didn’t have this option due to the information having to be on screen all at once.

Avoid using {{ }}  Expressions

The biggest issue that ng-cloak attempts to address isn’t so much displaying the original content – it’s displaying empty {{ }} markup expression tags that get embedded into content. It gives you the dreaded “now you see it, now you don’t” effect where you sometimes see three separate rendering states: Markup junk, empty views, then views filled with data.

If we can remove {{ }} expressions from the page you remove most of the perceived double draw effect as you would effectively start with a blank form and go straight to a filled form. To do this you can forego {{ }}  expressions and replace them with ng-bind directives on DOM elements.

For example you can turn:

<div class="list-item-name listViewOrderNo"><a href='#'>{{lineItem.MpsOrderNo}}</a></div>
into:
<div class="list-item-name listViewOrderNo"><a href="#" ng-bind="lineItem.MpsOrderNo"></a></div>

to get identical results but because the {{ }}  expression has been removed there’s no double draw effect for this element.

Again, not a great solution. The {{ }} syntax sure reads cleaner and is more fluent to type IMHO. In some cases you may also not have an outer element to attach ng-bind to which then requires you to artificially inject DOM elements into the page. This is especially painful if you have several consecutive values like {{Firstname}} {{Lastname}} for example. It’s an option though especially if you think of this issue up front and you don’t have a ton of expressions to deal with.

Add the ng-cloak Styles manually

You can also explicitly define the .css styles that Angular injects via code manually in your application’s style sheet. By doing so the styles become immediately available and so are applied right when the page loads – no flicker.

I use the minimal:

[ng-cloak]{display: none !important;
}

which works for:

<div id="mainContainer" class="mainContainer dialog boxshadow"ng-app="app" ng-cloak>

If you use one of the other combinations add the other CSS selectors as well or use the full style shown earlier. Angular will still load its version of the ng-cloak styling but it overrides those settings later, but this will do the trick of hiding the content before that CSS is injected into the page.

Adding the CSS in your own style sheet works well, and is IMHO by far the best option.

The nuclear option: Hiding the Content manually

Using the explicit CSS is the best choice, so the following shouldn’t ever be necessary. But I’ll mention it here as it gives some insight how you can hide/show content manually on load for other frameworks or in your own markup based templates.

Before I figured out that I could explicitly embed the CSS style into the page, I had tried to figure out why ng-cloak wasn’t doing its job. After wasting an hour getting nowhere I finally decided to just manually hide and show the container. The idea is simple – initially hide the container, then show it once Angular has done its initial processing and removal of the template markup from the page.

You can manually hide the content and make it visible after Angular has gotten control. To do this I used:

<div id="mainContainer" class="mainContainer boxshadow"ng-app="app" style="display:none">

Notice the display: none style that explicitly hides the element initially on the page.

Then once Angular has run its initialization and effectively processed the template markup on the page you can show the content. For Angular this ‘ready’ event is the app.run() function:

app.run( function ($rootScope, $location, cellService) { $("#mainContainer").show();

});

This effectively removes the display:none style and the content displays. By the time app.run() fires the DOM is ready to displayed with filled data or at least empty data – Angular has gotten control.

Edge Case

Clearly this is an edge case. In general the initial HTML pages tend to be reasonably sized and the load time for the HTML and Angular are fast enough that there’s no flicker between the rendering times. This only becomes an issue as the initial pages get rather large.

Regardless – if you have an Angular application it’s probably a good idea to add the CSS style into your application’s CSS (or a common shared one) just to make sure that content is always hidden. You never know how slow of a browser somebody might be running and while your super fast dev machine might not show any flicker, grandma’s old XP box very well might…

© Rick Strahl, West Wind Technologies, 2005-2014
Posted in Angular  JavaScript  CSS  HTML  

A dynamic RequireSsl Attribute for ASP.NET MVC

$
0
0

sslIn most of my Web applications I’m finding that I need to handle SSL activation dynamically rather than statically. IOW, depending on the environment that I’m running in I need to specify whether I want to enforce SSL or not. Specifically during development I typically want to run with SSL disabled and at runtime on my live server I want to force it on. On a staging server typically I don’t want to run SSL unless I have access to a configured certificate.

Typically there’s little reason to run SSL locally on development machines, and it certainly isn’t configured by default. Although IIS makes it pretty easy to create machine certificates these days, it’s still not quite automatic for SSL to ‘just work’ out of the box. I find especially in multi-developer environments or for staging and testing servers adding certificates is often a causing a problem or adding extra work that doesn’t really add any value on a non-production machine.

For these reasons I like to use a configuration switch to turn SSL on and off at runtime based on a configuration setting.

SSL and MVC

ASP.NET MVC provides the [RequireHttps] attribute that you can slap on a controller or controller method and which forces the affected requests to SSL. This works fine for static situations if you want to force a controller or method to SSL, but it’s on or off and you have to change code in order to change the value.

It’s easy enough to use: You simply apply the attribute to a control or individual controller methods and off you go.

Here’s what this looks like on a controller:

[RequireHttps]public class AccountController : AppBaseController

You can also assign [RequireHttps] to a method – if you don’t have it on the controller – to force individual methods to be accessed via SSL.

[RequireHttps]public ActionResult Login(string redirectUrl)  {…}

For example, this can be useful if you have a login API and you only want to protect your login pages or certain order pages in an online store etc. Personally, if I have a certificate on my site – these days I prefer to simply run the entire site in SSL since it’s more secure and also cleaner simply leaving all urls consistently in SSL rather than switching back and forth which can result in different urls that sometimes show up in SSL and sometimes now (because once you go to URL and then navigate to a non-SSL required URL you stay in SSL).

The implementation of this attribute is super simple – you can check out the code here on GitHub. Basically all this method does is check to see if the request is on a secure connection and if it isn’t, switch the URL to https by munging request URI and then redirecting to the same page with the new URL. It’s important to note that the attribute only works with GET requests, which makes sense, since a redirect cannot pass any POST content to the redirected page.

Working around [RequireHttps]

Because [RequireHttps] is an attribute it requires constant values as parameters, and there’s no option to dynamically determine whether the controller should run SSL or not. So it’s really all or nothing and a manual code change to flip behavior, which is not super useful if you want to parameterize SSL operation with a configuration switch or some other mechanism.

To get around the static setting in RequireHttps in the past I have simply created a custom attribute that overrides the RequireHttpsAttribute behavior, by subclassing it and creating my own attribute. I then handle the default constructor’s code and load a setting from within the application from a configuration store – in this case a simple configuration setting on a config class.

Here’s what this custom attribute looks like:

public class RequireHttpsWithFlagAttribute : RequireHttpsAttribute{public bool RequireSsl { get; set; }public RequireHttsWithFlagAttribute()
    {// Assign from App specific configuration objectRequireSsl = App.Configuration.RequireSsl;
    }public RequireHttpsWithFlagAttribute(bool requireSsl)
    {
        RequireSsl = requireSsl;
    }    public override void OnAuthorization(AuthorizationContext filterContext)
    {if (filterContext != null &&
            RequireSsl &&
            !filterContext.HttpContext.Request.IsSecureConnection)
        {
            HandleNonHttpsRequest(filterContext);
        }
    }
}

The key line in this subclassed version is the default constructor which overrides the RequireSsl flag with a configuration value which comes from my web.config file. Here I’m using the West Wind Application Configuration class to hold and retrieve my value, but the value could really come from anywhere as long as it’s globally available. In this case the App.Configuration is a static class so I can globally access it here in the attribute. You could use an AppSettings key or whatever else works for you for configuration.

This code also overrides the OnAuthorization call, duplicating the original functionality but adding in the RequireSsl flag setting as well into the filter condition.

Once this attribute has been created I can access it on a controller class or Action method just as I normally would do with [RequireHttps]:

[RequireHttpsWithFlag]public class AccountController : AppBaseController    

Because I use the default constructor, the attribute assigns the value from the configuration and that’s it – I’m in business with my dynamic value. You can also explicitly pass true or false to this attribute to enable and disable SSL behavior, which is nice for explicitly setting and removing SSL from requests.

Attributes are not Dynamic

This custom implementation works, but it’s a a drag to have to create this class for every project, since this code hardcodes my configuration setting. It works but it’s not generic.

It’d be nice if I could do something like (does not work!):

[RequireHttpsWithFlag(App.Configuration.RequireSsl)]

But as you can see by the red highlighting from Visual Studio, that doesn’t work. Other things that would be nice to pass here might be a delegate or lamda expression that could be called. But none of that works because only constant expressions are allowed.

If you try to use the above you get an error:

An attribute argument must be a constant expression, typeof expression or array creation expression of an attribute parameter type

Attributes require that values bound to the attribute parameters are a constant expression that can’t change at runtime. Part of the reason for this is that Attributes were primarily meant for MetaData and that meta data might be queried outside of a dynamic runtime environment. Without an application running dynamic values would fail but constant static values are always going to be available and work.

Of course we know that today attributes are used for a lot more than just metadata, but the restrictions are there and remain.

Note that although the attribute declaration requires constant values, however the actual attribute property data and values– once you get a hold of an attribute or internally as you run code in a custom attribute – can be modified at runtime. This means there’s hope that we can maybe work around the constant limitations.

Attribute Fakery

The ideal scenario for a custom Attribute would be that you could hook up a Delegate and call it to get values at runtime explicitly. But alas delegates are also not allowed even if pointing at static methods.

The easiest way to work around this is to use attribute parameters that are strings. So I decided we can easily create an implementation that’s a little more dynamic. I create a RequireSslAttribute class which allows for the following:

  • Explicitly specify the value for the RequireSsl (true or false)
  • Specify appSettings key name as a string
  • Specify a static method by providing a type and method name as a string

The first is pretty obvious. [RequireHttps] is either there or not but there’s no way to specify explicitly whether it’s on or off. Sometimes it’s nice to be explicit especially if you flip the switch manually from time to time.

An appSettings key is a simple and obvious choice. It’s a simple string value you can set and appSettings tends to be available anywhere. This option tries to find the specified key and looks for True or 1 as a string value. If found RequireSsl is set to true otherwise it’s false.

The last one is a bit more esoteric and a bit of a hack, but if you need to more complex logic or simply something that needs to get a value from your application, then this provides a poor emulation of a delegate. You provide a type reference and string that is the name of a static method to invoke on that type. The method should return true or false which is then assigned to RequireSsl.

Let’s take a look how to implement this:

/// <summary>
/// Allows for dynamically assigning the RequireSsl property at runtime/// either with an explicit boolean constant, a configuration setting,/// or a Reflection based 'delegate' /// </summary>public class RequireSslAttribute : RequireHttpsAttribute{public bool RequireSsl { get; set; }/// <summary>
    /// Default constructor forces SSL required/// </summary>public RequireSslAttribute()
    {RequireSsl = true;
    }/// <summary>
    /// Allows assignment of the SSL status via parameter/// </summary>
    /// <param name="requireSsl"></param>public RequireSslAttribute(bool requireSsl)
    {
        RequireSsl = requireSsl;
    }/// <summary>
    /// Allows invoking a static method at runtime to check for a /// value dynamically./// 
    /// Note: The method called must be a static method/// </summary>
    /// <param name="typeName">Fully qualified type name on which the method to call exists</param>
    /// <param name="method">Static method on this type to invoke with no parameters</param>public RequireSslAttribute(Type type, string method)
    {var mi = type.GetMethod(method, BindingFlags.Static | BindingFlags.InvokeMethod | BindingFlags.Public);
        RequireSsl = (bool)mi.Invoke(type, null);
    }/// <summary>
    /// Looks for an appSetting key you specify and if it exists/// and is set to true or 1 which forces SSL./// </summary>
    /// <param name="appSettingsKey"></param>public RequireSslAttribute(string appSettingsKey)
    {string key = ConfigurationManager.AppSettings[appSettingsKey] as string;
        RequireSsl = false;if (!string.IsNullOrEmpty(key))
        {
            key = key.ToLower();if (key == "true" || key == "1")
                RequireSsl = true;
        }
    }public override void OnAuthorization(AuthorizationContext filterContext)
    {if (filterContext != null &&
            RequireSsl &&
            !filterContext.HttpContext.Request.IsSecureConnection)
        {
            HandleNonHttpsRequest(filterContext);
        }
    }
}

The implementation is similar to the non-generic version I showed earlier: I subclass RequireHttpsAttribute and override OnAuthorization. I use a RequireSsl property on the attribute to hold my ‘state’ which is set by the various constructors that implement the configuration value retrieval.

AppSettings Value

The appSettings value is probably the easiest way to use this. You can simply add a key to the <appSettings> section in web.config:

<appSettings><add key="webpages:Version" value="3.0.0.0" /><add key="webpages:Enabled" value="true" /><add key="ClientValidationEnabled" value="true" /><add key="UnobtrusiveJavaScriptEnabled" value="false" /><add key="app:RequireSsl" value="True"/></appSettings>

And then reference that key in your [RequireSsl] attribute usage:

[RequireSsl("app:RequireSsl")]public class AccountController : AppBaseController {…}

Notice that I like to use an app: prefix for my application specific settings to keep them easily recognizable from all the stuff that ASP.NET MVC dumps into app settings these days.

String ‘Delegate’

Personally I really don’t like to use appSettings for a number of reasons. Rather I tend to store my configuration setting in a configuration class. In order to get the value from my configuration class I can use the ‘delegate’ implementation. To use it I can create a custom static method in my application somewhere:

public class App{

public static bool GetRequireSsl()

{

return App.Configuration.RequireSsl; }

}

In my apps I tend to have an App object that’s sort of a global ‘miscellaneous’ object. Among other things I have static configuration settings, global constants, some reusable look up lists and other stuff attached to it typically. Since the SSL delegate falls under ‘miscellaneous’ stuff this seems like a good place for hooking the method there. The method simply returns a simple configuration value from my configuration object.

To hook this up to the controller I can now do this:

[RequireSsl(typeof(App), "GetRequireSsl")]public class AccountController : AppBaseController

The ‘delegate’ implementation uses reflection trying to invoke the method on the static type by using GetMethod() and invoking the static method directly. This is where ‘magic strings’ comes in – if the method is mistyped or has an error your code will blow up. This is pretty hacky, but I found this useful to hook up to arbitrary application logic without having to always add a custom Attribute to each project.

And voila we now have a lot more options for dynamically setting our SSL options at runtime.

RequireSsl fires only once per Controller/Method

While playing around with this I noticed that RequireSslAttribute is only called once for each controller or method that it’s attached to per Application domain life time. It appears that the attribute is instantiated once and then cached for further usage so the constructors only fire once for each controller/method. This means that although the delegate implementation uses Reflection performance is not an issue since there’s only one invocation per attribute usage.

Apply to Attributes in  General

The lack of dynamic assignment to attributes is something that I’ve often struggled with and the concepts described here can be used for other attributes as well. Essentially you can always create custom attributes that take in string parameters and then either read values from configuration or allow some sort of delegate process to call off and read additional information at runtime as I’ve done with the ‘delegate’ implementation. There are lots of use cases for this and I’m pretty sure I’ll use this for other attributes in the future.

Resources

© Rick Strahl, West Wind Technologies, 2005-2014
Posted in ASP.NET  MVC  Security  

Nuget Dependencies and latest Versions

$
0
0

NuGet is one of the best things that happened to .NET, to make it easier to share and distributed shared components. NuGet has become Microsoft’s main inclusion mechanism (and it looks to be come even more prominent in ASPvNext which eschews binary deployments for NuGet packages). And there are a bazillion third party components you can now get through NuGet. While it’s not all unicorns and rainbows, NuGet has been one of the nicest additions to .NET to move the platform forward.

Personally I also use NuGet to distribute a host of Westwind libraries as part of the Westwind.Toolkit. I update those libraries frequently and it’s made it super easy to get new versions out and distributed to existing users, as well for my own work. Whether internal or external it’s a nice way to push components into applications.

Publishing and Dependency Management

However, when it comes to publishing NuGet packages I’ve had more than a little trouble getting my dependencies to come in with the proper version. Basically when you create a component that has a dependency on another component you can specify a version number or number range that you are depending on.

For example, here is the Westwind.Data nuget which depends on Westwind.Utilities and depends on version 2.50 and later:

<dependencies><dependency id="Westwind.Utilities" version="[2.50,3.0)" /><dependency id="EntityFramework" version="6.1.0" /></dependencies>

This basically says to depend on version 2.50 or higher up to version 2.99 (anything under 3.0) of Westwind.Utilities.

Now when I read the rather cryptic page that describes the dependency version management here:

My interpretation of the expression above based on that documentation would be – load version the highest version as long as it’s lower than 3.0.But that’s not actually what happens. In fact, quite the opposite occurs: Rather than loading the latest version, the smallest possible version is used, so even though the current version on NuGet for Westwind.Utilities is at 2.55, if you add this NuGet it’ll load version 2.50.

Here’s an article that describes NuGet’s default behavior (thanks to @BrianDukes):

It would be really helpful if the behavior described in the second article was also provided in the first. Duh! ‘Cause you know, that’s kind of crucial information that’s not freaking obvious!

To demonstrate: This gets much worse if you use the following syntax (which I accidentally used at first):

<dependency id="Westwind.Utilities" version="[,3.0)" />

which looks like it would mean to load any version lower than 3.0. But in fact it’ll load the lowest version which is 1.27, which is a totally incompatible version (2.0 had breaking changes). So at the very least it’s always best to include a lower boundary version, but even if I specifed:

<dependency id="Westwind.Utilities" version="[2.0,3.0)" />

it would work, but this would always load 2.0 unless a higher version already existed in the project.

I’m not sure why anybody would ever use this option when you explicitly provide high and low version constraints? When would you ever want to load an old component knowing that it would always load the old one? This seems rather pointless.

It seems the only option I really have here to get the latest version to load is to explicitly provide the latest version that is current and provide in the lower version explicitly and match it to the current version:

<dependency id="Westwind.Utilities" version="[2.55,3.0)" />

That way at least I get the latest version that was available at the time the component was created.

But the downside to that is that older versions that might already be in the project would not be allowed and you’d end up with a version conflict unless all components are upgraded to this latest version.

You can see how this gets ugly really quick. This is not all NuGet’s fault BTW – this is really a versioning issue, but it hits when the components are installed and requested in the first place and the point of entry where the pain occurs happens to be NuGet. The issue is really component dependency versioning and runtime binding, where a single application might have multiple dependencies on the same assembly with different versions. There are no easy answers here and I don’t want to get into this argument because that’s an endless discussion – and hopefully this will be addressed much better in the new ASPvNext stack that seems to allow for side by side execution of the same assemblies (via Roslyn magic perhaps)?

Lowest Common Denominator and Overriding

NuGet by default loads the lowest possible version it can match. In this case that’s 2.50, even though 2.55 is available. There’s a bit of discussion on why this somewhat unintuitive behavior occurs. Summarized, it amounts to this: lower versions are safer and avoid pulling in newer versions of components that might break existing applications/components that depend on the same component. It avoids pulling in newer versions in unconditionally.

This behavior can be explicitly overridden by explicitly running a component install with an extra switch:

http://blog.myget.org/post/2014/05/05/Picking-the-right-dependency-version-adding-packages-from-NuGet.aspx

which amounts to this:

PM> install-package westwind.utilities  -DependencyVersion Highest

That’s nice, but as a package author that still leaves you unable to force the latest version even if you explicitly delimit your version range as I’ve done above *and* you want to support older versions as well for backwards compatible loading.

NuGet should be smarter than that!

I can see the argument of making sure projects are not broken by components automatically revving to a new higher version.

But it seems to me that NuGet should be smart enough to detect if you’re installing a component with a dependency for the first time when you have an upper version constraint and in that case it should install the LATEST version allowed of that component. There’s no point to add a new component with an old version UNLESS there’s a conflict with an existing package that is already installed in the project.

As it stands today, the version range features don’t really behave the way I would expect them to work. The ranges don’t really apply a range of versions to install, but rather act as a restraint to ensure you’re not stepping on an existing component by checking that an already installed component is in the version range allowed. But as for installation, the default to the lowest version pretty much ensures that NuGet always installs the lowest version, which is pretty lame if you think about it.

If the component is already installed and it’s in the range that’s valid then I can understand leaving the existing component alone and that would be the correct behavior in order to not accidentally screw up dependencies. We can then manually do the

update-package westwind.utilities

to get the component to the latest version in that scenario.

But in the case where the dependency is loaded for the very first time, it makes no sense to load the oldest version… Discuss.

© Rick Strahl, West Wind Technologies, 2005-2014
Posted in .NET  

Project Navigation and File Nesting in ASP.NET MVC Projects

$
0
0

More and more I’m finding myself getting lost in the files in some of my larger Web projects. There’s so much freaking content to deal with – HTML Views, several derived CSS pages, page level CSS, script libraries, application wide scripts and page specific script files etc. etc. Thankfully I use Resharper and the Ctrl-T Go to Anything which autocompletes you to any file, type, member rapidly. Awesome except when I forget – or when I’m not quite sure of the name of what I’m looking for. Project navigation is still important.

Sometimes while working on a project I seem to have 30 or more files open and trying to locate another new file to open in the solution often ends up being a mental exercise – “where did I put that thing?” It’s those little hesitations that tend to get in the way of workflow frequently.

To make things worse most NuGet packages for client side frameworks and scripts, dump stuff into folders that I generally don’t use. I’ve never been a fan of the ‘Content’ folder in MVC which is just an empty layer that doesn’t serve much of a purpose. It’s usually the first thing I nuke in every MVC project. To me the project root is where the actual content for a site goes – is there really a need to add another folder to force another path into every resource you use? It’s ugly and also inefficient as it adds additional bytes to every resource link you embed into a page.

Alternatives

I’ve been playing around with different folder layouts recently and found that moving my cheese around has actually made project navigation much easier. In this post I show a couple of things I’ve found useful and maybe you find some of these useful as well or at least get some ideas what can be changed to provide better project flow.

The first thing I’ve been doing is add a root Code folder and putting all server code into that. I’m a big fan of treating the Web project root folder as my Web root folder so all content comes from the root without unneeded nesting like the Content folder. By moving all server code out of the root tree (except for Code) the root tree becomes a lot cleaner immediately as you remove Controllers, App_Start, Models etc. and move them underneath Code. Yes this adds another folder level for server code, but it leaves only code related things in one place that’s easier to jump back and forth in. Additionally I find myself doing a lot less with server side code these days, more with client side code so I want the server code separated from that.

The root folder itself then serves as the root content folder. Specifically I have the Views folder below it, as well as the Css and Scripts folders which serve to hold only common libraries and global CSS and Scripts code. These days of building SPA style application, I also tend to have an App folder there where I keep my application specific JavaScript files, as well as HTML View templates for client SPA apps like Angular.

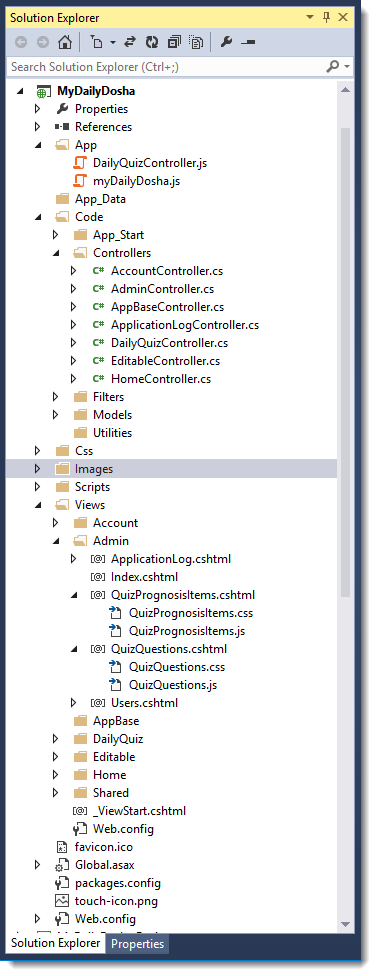
Here’s an example of what this looks like in a relatively small project:

Project Layout

The goal is to keep things that are related together, so I don’t end up jumping around so much in the solution to get to specific project items. The Code folder may irk some of you and hark back to the days of the App_Code folder in non Web-Application projects, but these days I find myself messing with a lot less server side code and much more with client side files – HTML, CSS and JavaScript. Generally I work on a single controller at a time – once that’s open it’s open that’s typically the only server code I work with regularily. Business logic lives in another project altogether, so other than the controller and maybe ViewModels there’s not a lot of code being accessed in the Code folder. So throwing that off the root and isolating seems like an easy win.

Nesting Page specific content

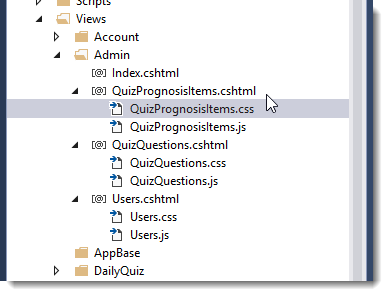
In a lot of my existing applications that are pure server side MVC application perhaps with some JavaScript associated with them , I tend to have page level javascript and css files. For these types of pages I actually prefer the local files stored in the same folder as the parent view. So typically I have a .css and .js files with the same name as the view in the same folder.

This looks something like this:

filenesting

In order for this to work you have to also make a configuration change inside of the /Views/web.config file, as the Views folder is blocked with the BlockViewHandler that prohibits access to content from that folder. It’s easy to fix by changing the path from * to *.cshtml or *.vbhtml so that view retrieval is blocked:

<system.webServer><handlers><remove name="BlockViewHandler"/><add name="BlockViewHandler" path="*.cshtml"verb="*"
preCondition="integratedMode"
type="System.Web.HttpNotFoundHandler" /></handlers></system.webServer>

With this in place, from inside of your Views you can then reference those same resources like this:

<link href="~/Views/Admin/QuizPrognosisItems.css" rel="stylesheet" />

and

<script src="~/Views/Admin/QuizPrognosisItems.js"></script>

which works fine. JavaScript and CSS files in the Views folder deploy just like the .cshtml files do and can be referenced from this folder as well.

Making this happen is not really as straightforward as it should be with just Visual Studio unfortunately, as there’s no easy way to get the file nesting from the VS IDE directly (you have to modify the .csproj file).

However, Mads Kristensen has a nice Visual Studio Add-in that provides file nesting via a short cut menu option. Using this you can select each of the ‘child’ files and then nest them under a parent file. In the case above I select the .js and .css files and nest them underneath the .cshtml view.

FileNesting[1]

I was even toying with the idea of throwing the controller.cs files into the Views folder, but that’s maybe going a little too far :-) It would work however as Visual Studio doesn’t publish .cs files and the compiler doesn’t care where the files live. There are lots of options and if you think that would make life easier it’s another option to help group related things together.

Are there any downside to this? Possibly – if you’re using automated minification/packaging tools like ASP.NET Bundling or Grunt/Gulp with Uglify, it becomes a little harder to group script and css files for minification as you may end up looking in multiple folders instead of a single folder. But – again that’s a one time configuration step that’s easily handled and much less intrusive then constantly having to search for files in your project.

Client Side Folders

The particular project shown above in the screen shots above is a traditional server side ASP.NET MVC application with most content rendered into server side Razor pages. There’s a fair amount of client side stuff happening on these pages as well – specifically several of these pages are self contained single page Angular applications that deal with 1 or maybe 2 separate views and the layout I’ve shown above really focuses on the server side aspect where there are Razor views with related script and css resources.

For applications that are more client centric and have a lot more script and HTML template based content I tend to use the same layout for the server components, but the client side code can often be broken out differently.

In SPA type applications I tend to follow the App folder approach where all the application pieces that make the SPA applications end up below the App folder.

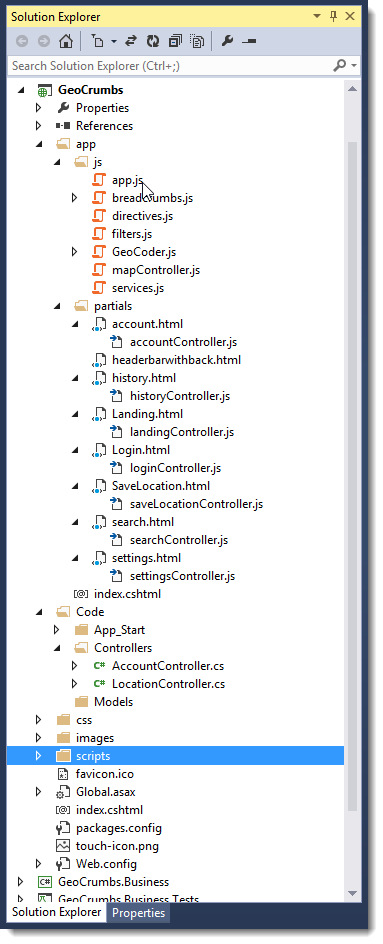
Here’s what that looks like for me – here this is an AngularJs project:

ScriptProject

In this case the App folder holds both the application specific js files, and the partial HTML views that get loaded into this single SPA page application.

In this particular Angular SPA application that has controllers linked to particular partial views, I prefer to keep the script files that are associated with the views – Angular Js Controllers in this case – with the actual partials. Again I like the proximity of the view with the main code associated with the view, because 90% of the UI application code that gets written is handled between these two files.

This approach works well, but only if controllers are fairly closely aligned with the partials. If you have many smaller sub-controllers or lots of directives where the alignment between views and code is more segmented this approach starts falling apart and you’ll probably be better off with separate folders in js folder. Following Angular conventions you’d have controllers/directives/services etc. folders.

Please note that I’m not saying any of these ways are right or wrong  – this is just what has worked for me and why!

Skipping Project Navigation altogether with Resharper

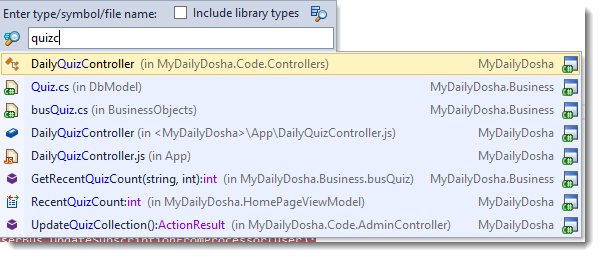
I’ve talked a bit about project navigation in the project tree, which is a common way to navigate and which we all use at least some of the time, but if you use a tool like Resharper– which has Ctrl-T to jump to anything, you can quickly navigate with a shortcut key and autocomplete search.

Here’s what Resharper’s jump to anything looks like:

ResharperGotoAnything

Resharper’s Goto Anything box lets you type and quick search over files, classes and members of the entire solution which is a very fast and powerful way to find what you’re looking for in your project, by passing the solution explorer altogether. As long as you remember to use (which I sometimes don’t) and you know what you’re looking for it’s by far the quickest way to find things in a project. It’s a shame that this sort of a simple search interface isn’t part of the native Visual Studio IDE.

Work how you like to work

Ultimately it all comes down to workflow and how you like to work, and what makes *you* more productive. Following pre-defined patterns is great for consistency, as long as they don’t get in the way you work. A lot of the default folder structures in Visual Studio for ASP.NET MVC were defined when things were done differently. These days we’re dealing with a lot more diverse project content than when ASP.NET MVC was originally introduced and project organization definitely is something that can get in the way if it doesn’t fit your workflow. So take a look and see what works well and what might benefit from organizing files differently.

As so many things with ASP.NET, as things evolve and tend to get more complex I’ve found that I end up fighting some of the conventions. The good news is that you don’t have to follow the conventions and you have the freedom to do just about anything that works for you.

Even though what I’ve shown here diverges from conventions, I don’t think anybody would stumble over these relatively minor changes and not immediately figure out where things live, even in larger projects. But nevertheless think long and hard before breaking those conventions – if there isn’t a good reason to break them or the changes don’t provide improved workflow then it’s not worth it. Break the rules, but only if there’s a quantifiable benefit.

You may not agree with how I’ve chosen to divert from the standard project structures in this article, but maybe it gives you some ideas of how you can mix things up to make your existing project flow a little nicer and make it easier to navigate for your environment.

© Rick Strahl, West Wind Technologies, 2005-2014
Posted in ASP.NET  MVC  

West Wind WebSurge - an easy way to Load Test Web Applications

$
0
0

A few months ago on a project the subject of load testing came up. We were having some serious issues with a Web application that would start spewing SQL lock errors under somewhat heavy load. These sort of errors can be tough to catch, precisely because they only occur under load and not during typical development testing. To replicate this error more reliably we needed to put a load on the application and run it for a while before these SQL errors would flare up.

It’s been a while since I’d looked at load testing tools, so I spent a bit of time looking at different tools and frankly didn’t really find anything that was a good fit. A lot of tools were either a pain to use, didn’t have the basic features I needed, or are extravagantly expensive. In  the end I got frustrated enough to build an initially small custom load test solution that then morphed into a more generic library, then gained a console front end and eventually turned into a full blown Web load testing tool that is now called West Wind WebSurge.

I got seriously frustrated looking for tools every time I needed some quick and dirty load testing for an application. If my aim is to just put an application under heavy enough load to find a scalability problem in code, or to simply try and push an application to its limits on the hardware it’s running I shouldn’t have to have to struggle to set up tests. It should be easy enough to get going in a few minutes, so that the testing can be set up quickly so that it can be done on a regular basis without a lot of hassle. And that was the goal when I started to build out my initial custom load tester into a more widely usable tool.

If you’re in a hurry and you want to check it out, you can find more information and download links here:

For a more detailed discussion of the why’s and how’s and some background continue reading.

How did I get here?

When I started out on this path, I wasn’t planning on building a tool like this myself – but I got frustrated enough looking at what’s out there to think that I can do better than what’s available for the most common simple load testing scenarios.

When we ran into the SQL lock problems I mentioned, I started looking around what’s available for Web load testing solutions that would work for our whole team which consisted of a few developers and a couple of IT guys both of which needed to be able to run the tests. It had been a while since I looked at tools and I figured that by now there should be some good solutions out there, but as it turns out I didn’t really find anything that fit our relatively simple needs without costing an arm and a leg…

I spent the better part of a day installing and trying various load testing tools and to be frank most of them were either terrible at what they do, incredibly unfriendly to use, used some terminology I couldn’t even parse, or were extremely expensive (and I mean in the ‘sell your liver’ range of expensive). Pick your poison. There are also a number of online solutions for load testing and they actually looked more promising, but those wouldn’t work well for our scenario as the application is running inside of a private VPN with no outside access into the VPN. Most of those online solutions also ended up being very pricey as well – presumably because of the bandwidth required to test over the open Web can be enormous.

When I asked around on Twitter what people were using– I got mostly… crickets. Several people mentioned Visual Studio Load Test, and most other suggestions pointed to online solutions. I did get a bunch of responses though with people asking to let them know what I found – apparently I’m not alone when it comes to finding load testing tools that are effective and easy to use.

As to Visual Studio, the higher end skus of Visual Studio and the test edition include a Web load testing tool, which is quite powerful, but there are a number of issues with that: First it’s tied to Visual Studio so it’s not very portable – you need a VS install. I also find the test setup and terminology used by the VS test runner extremely confusing. Heck, it’s complicated enough that there’s even a Pluralsight course on using the Visual Studio Web test from Steve Smith. And of course you need to have one of the high end Visual Studio Skus, and those are mucho Dinero ($$$) – just for the load testing that’s rarely an option.

Some of the tools are ultra extensive and let you run analysis tools on the target serves which is useful, but in most cases – just plain overkill and only distracts from what I tend to be ultimately interested in: Reproducing problems that occur at high load, and finding the upper limits and ‘what if’ scenarios as load is ramped up increasingly against a site. Yes it’s useful to have Web app instrumentation, but often that’s not what you’re interested in.

I still fondly remember early days of Web testing when Microsoft had the WAST (Web Application Stress Tool) tool, which was rather simple – and also somewhat limited – but easily allowed you to create stress tests very quickly. It had some serious limitations (mainly that it didn’t work with SSL),  but the idea behind it was excellent: Create tests quickly and easily and provide a decent engine to run it locally with minimal setup. You could get set up and run tests within a few minutes. Unfortunately, that tool died a quiet death as so many of Microsoft’s tools that probably were built by an intern and then abandoned, even though there was a lot of potential and it was actually fairly widely used. Eventually the tools was no longer downloadable and now it simply doesn’t work anymore on higher end hardware.

West Wind Web Surge – Making Load Testing Quick and Easy

So I ended up creating West Wind WebSurge out of rebellious frustration…

The goal of WebSurge is to make it drop dead simple to create load tests. It’s super easy to capture sessions either using the built in capture tool (big props to Eric Lawrence, Telerik and FiddlerCore which made that piece a snap), using the full version of Fiddler and exporting sessions, or by manually or programmatically creating text files based on plain HTTP headers to create requests.

I’ve been using this tool for 4 months now on a regular basis on various projects as a reality check for performance and scalability and it’s worked extremely well for finding small performance issues. I also use it regularly as a simple URL tester, as it allows me to quickly enter a URL plus headers and content and test that URL and its results along with the ability to easily save one or more of those URLs.

A few weeks back I made a walk through video that goes over most of the features of WebSurge in some detail:

Note that the UI has slightly changed since then, so there are some UI improvements. Most notably the test results screen has been updated recently to a different layout and to provide more information about each URL in a session at a glance.

The video and the main WebSurge site has a lot of info of basic operations. For the rest of this post I’ll talk about a few deeper aspects that may be of interest while also giving a glance at how WebSurge works.

Session Capturing

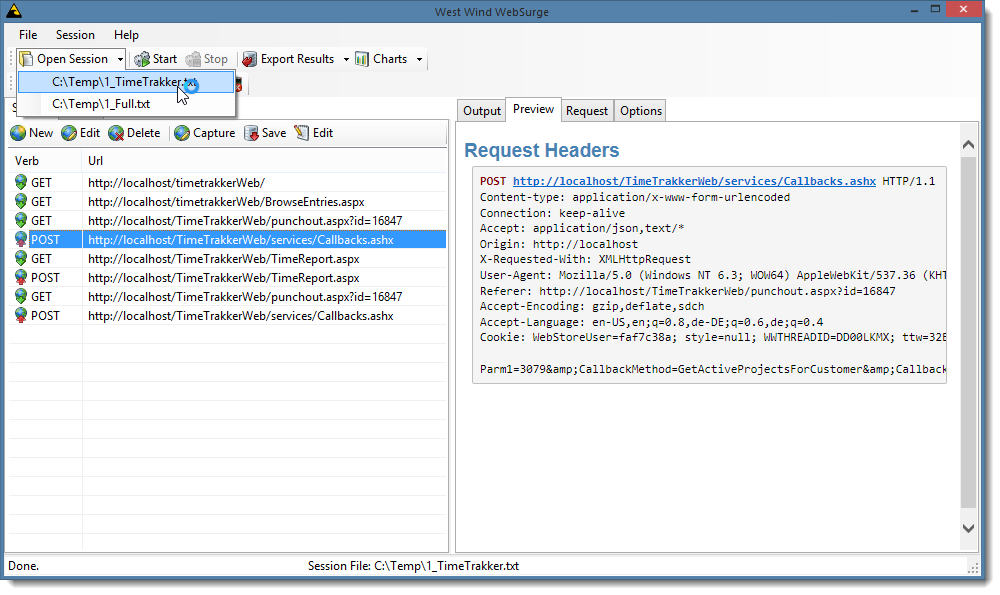
As you would expect, WebSurge works with Sessions of Urls that are played back under load. Here’s what the main Session View looks like:

Sessions

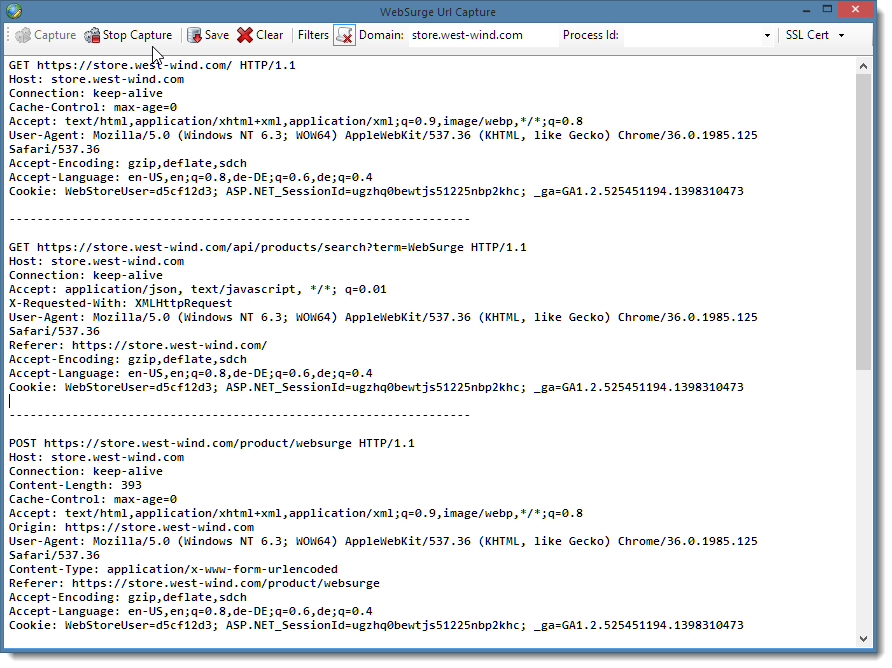
You can create session entries manually by individually adding URLs to test (on the Request tab on the right) and saving them, or you can capture output from Web Browsers, Windows Desktop applications that call services, your own applications using the built in Capture tool.

With this tool you can capture anything HTTP -SSL requests and content from Web pages, AJAX calls, SOAP or REST services – again anything that uses Windows or .NET HTTP APIs. Behind the scenes the capture tool uses FiddlerCore so basically anything you can capture with Fiddler you can also capture with Web Surge Session capture tool. Alternately you can actually use Fiddler as well, and then export the captured Fiddler trace to a file, which can then be imported into WebSurge. This is a nice way to let somebody capture session without having to actually install WebSurge or for your customers to provide an exact playback scenario for a given set of URLs that cause a problem perhaps.

The capture tool also has handy optional filters that allow you to filter by domain, to help block out noise that you typically don’t want to include in your requests. For example, if your pages include links to CDNs, or Google Analytics or social links you typically don’t want to include those in your load test, so by capturing just from a specific domain you are guaranteed content from only that one domain. Additionally you can provide url filters in the configuration file – filters allow to provide filter strings that if contained in a url will cause requests to be ignored. Again this is useful if you don’t filter by domain but you want to filter out things like static image, css and script files etc. Often you’re not interested in the load characteristics of these static and usually cached resources as they just add noise to tests and often skew the overall url performance results. In my testing I tend to care only about my dynamic requests.

In short, WebSurge tries hard to make it easy to capture URL content that you’re interested in to make it quick and easy to create sessions that you can play back.

Session Storage

Sessions can be saved and restored easily as they use a very simple text format that can be save and restored easily from disk. The format is simply slightly customized HTTP header traces separated by a separator line. The headers are standard HTTP headers except that the full URL instead of just the domain relative path is stored as part of the 1st HTTP header line for easier parsing.

Because it’s just text and uses the same format that Fiddler uses for exports, it’s super easy to create Sessions by hand manually or under program control writing out to a simple text file. You can see what this format looks like in the Capture window Figure above. So rather than the domain relative path in the 1st HTTP header and a Host: header the full URL is displayed. The rest of each header is just plain standard HTTP headers with each URL separated by a separator line. The format used here closely follows what Fiddler uses so it’s easy to exchange or view data either in Fiddler or WebSurge.

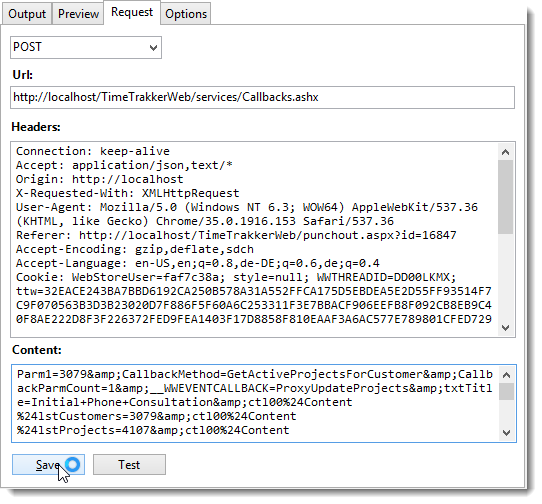
Urls can also be edited interactively so you can modify the headers easily as well:

RequestEditing

Again – it’s just plain HTTP headers so anything you can do with HTTP can be added here.

Incidentally I’ve found that this form is also an excellent way to test and replay individual URLs for simple non-load testing purposes. Because you can capture a single or many URLs and store them on disk, this also provides a nice HTTP playground where you can record URLs with their headers, and fire them one at a time or as a session and see results immediately. Finally you can save one or more URLs as a session for later retrieval. I’m using this more and more for simple URL checks.

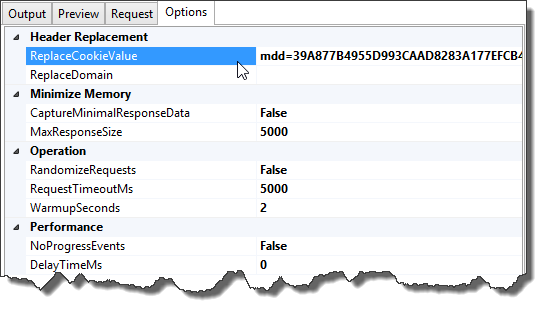
Speaking of HTTP headers – you can also overwrite cookies used as part of the options. One thing that happens with modern Web applications is that you have session cookies in use for authorization. These cookies tend to expire at some point which would invalidate a test. Using the Options dialog you can actually override the cookie:

CookieOverride

which replaces the cookie for all requests with the cookie value specified here. You can capture a valid cookie from a manual HTTP request in your browser and then paste into the cookie field, to replace the existing Cookie with the new one that is now valid. Likewise you can easily replace the domain so if you captured urls on west-wind.com and now you want to test on localhost you can do that easily easily as well. You could even do something like capture on store.west-wind.com and then test on localhost/store which would also work.

Running Load Tests

Once you’ve created a Session you can specify the length of the test in seconds, and specify the number of simultaneous threads to run each session on. Sessions run through each of the URLs in the session sequentially by default. One option in the options list above is that you can also randomize the URLs so each thread runs requests in a different order. This avoids bunching up URLs initially when tests start as all threads run the same requests simultaneously which can sometimes skew the results of the first few minutes of a test.

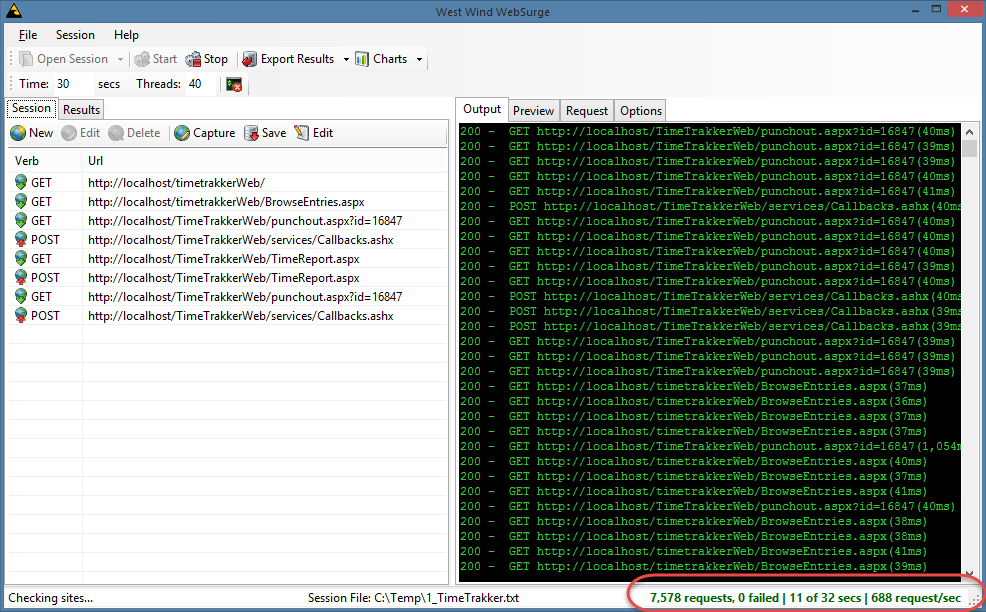
While sessions run some progress information is displayed:

Progress

By default there’s a live view of requests displayed in a Console-like window. On the bottom of the window there’s a running total summary that displays where you’re at in the test, how many requests have been processed and what the requests per second count is currently for all requests.

Note that for tests that run over a thousand requests a second it’s a good idea to turn off the console display. While the console display is nice to see that something is happening and also gives you slight idea what’s happening with actual requests, once a lot of requests are processed, this UI updating actually adds a lot of CPU overhead to the application which may cause the actual load generated to be reduced. If you are running a 1000 requests a second there’s not much to see anyway as requests roll by way too fast to see individual lines anyway. If you look on the options panel, there is a NoProgressEvents option that disables the console display. Note that the summary display is still updated approximately once a second so you can always tell that the test is still running.

Test Results

When the test is done you get a simple Results display:

ResultsDisplay 

On the right you get an overall summary as well as breakdown by each URL in the session. Both success and failures are highlighted so it’s easy to see what’s breaking in your load test. The report can be printed or you can also open the HTML document in your default Web Browser for printing to PDF or saving the HTML document to disk.

The list on the right shows you a partial list of the URLs that were fired so you can look in detail at the request and response data. The list can be filtered by success and failure requests. Each list is partial only (at the moment) and limited to a max of 1000 items in order to render reasonably quickly.

Each item in the list can be clicked to see the full request and response data:

ResultsDisplay[1]

This particularly useful for errors so you can quickly see and copy what request data was used and in the case of a GET request you can also just click the link to quickly jump to the page. For non-GET requests you can find the URL in the Session list, and use the context menu to Test the URL as configured including any HTTP content data to send.

You get to see the full HTTP request and response as well as a link in the Request header to go visit the actual page. Not so useful for a POST as above, but definitely useful for GET requests.

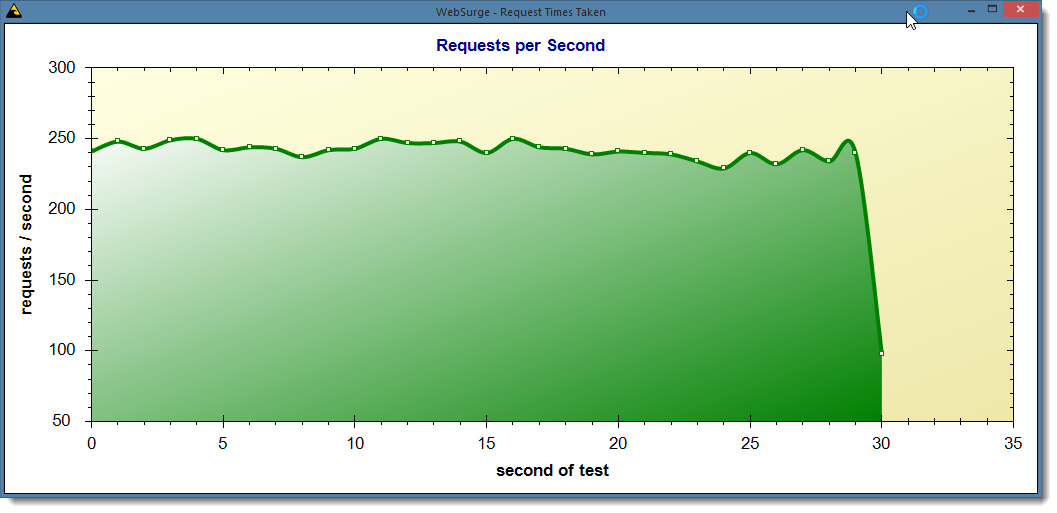
Finally you can also get a few charts. The most useful one is probably the Request per Second chart which can be accessed from the Charts menu or shortcut. Here’s what it looks like:

Chart 

Results can also be exported to JSON, XML and HTML. Keep in mind that these files can get very large rather quickly though, so exports can end up taking a while to complete.

Command Line Interface

WebSurge runs with a small core load engine and this engine is plugged into the front end application I’ve shown so far.

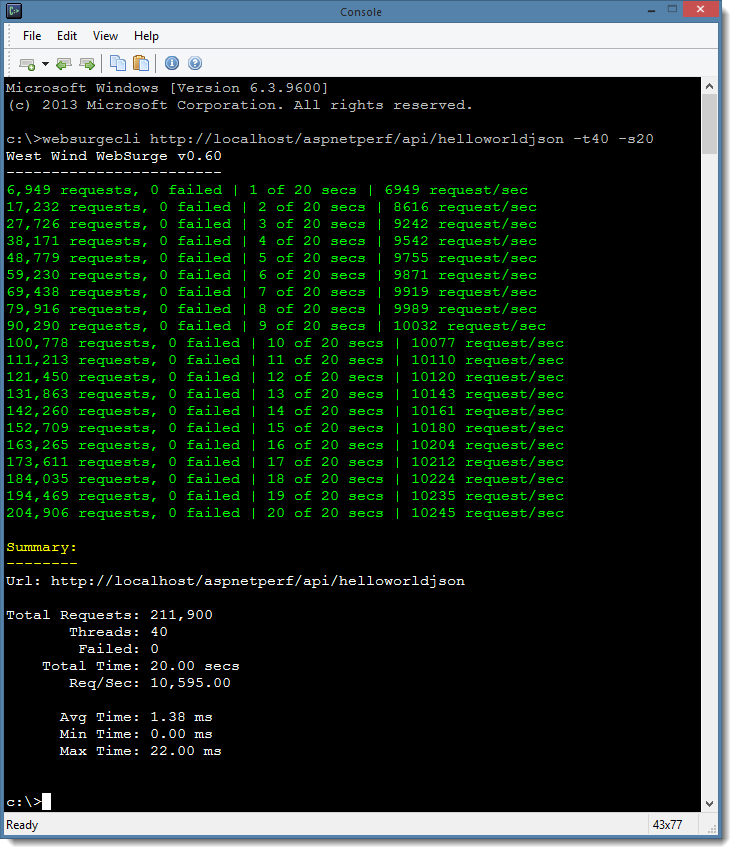
There’s also a command line interface available to run WebSurge from the Windows command prompt. Using the command line you can run tests for either an individual URL (similar to AB.exe for example) or a full Session file.

Console

By default when it runs WebSurgeCli shows progress every second showing total request count, failures and the requests per second for the entire test. A silent option can turn off this progress display and display only the results.

The command line interface can be useful for build integration which allows checking for failures perhaps or hitting a specific requests per second count etc.

It’s also nice to use this as quick and dirty URL test facility similar to the way you’d use Apache Bench (ab.exe). Unlike ab.exe though, WebSurgeCli supports SSL and makes it much easier to create multi-URL tests using either manual editing or the WebSurge UI.

Current Status

Currently West Wind WebSurge is still in Beta status. I’m still adding small new features and tweaking the UI in an attempt to make it as easy and self-explanatory as possible to run. Documentation for the UI and specialty features is also still a work in progress.

I plan on open-sourcing this product, but it won’t be free. There’s a free version available that provides a limited number of threads and request URLs to run. A relatively low cost license  removes the thread and request limitations. Pricing info can be found on the Web site – there’s an introductory price which is $99 at the moment which I think is reasonable compared to most other for pay solutions out there that are exorbitant by comparison…

The reason code is not available yet is – well, the UI portion of the app is a bit embarrassing in its current monolithic state. The UI started as a very simple interface originally that later got a lot more complex – yeah, that never happens, right? Unless there’s a lot of interest I don’t foresee re-writing the UI entirely (which would be ideal), but in the meantime at least some cleanup is required before I dare to publish it :-).

The code will likely be released with version 1.0.

I’m very interested in feedback. Do you think this could be useful to you and provide value over other tools you may or may not have used before? I hope so – it already has provided a ton of value for me and the work I do that made the development worthwhile at this point. You can leave a comment below, or for more extensive discussions you can post a message on the West Wind Message Board in the WebSurge section

Microsoft MVPs and Insiders get a free License

If you’re a Microsoft MVP or a Microsoft Insider you can get a full license for free. Send me a link to your current, official Microsoft profile and I’ll send you a not-for resale license. Send any messages to sales@west-wind.com.

Resources

For more info on WebSurge and to download it to try it out, use the following links.

© Rick Strahl, West Wind Technologies, 2005-2014
Posted in ASP.NET  

Using FiddlerCore to capture HTTP Requests with .NET

$
0
0

Over the last few weeks I’ve been working on my Web load testing utility West Wind WebSurge. One of the key components of a load testing tool is the ability to capture URLs effectively so that you can play them back later under load. One of the options in WebSurge for capturing URLs is to use its built-in capture tool which acts as an HTTP proxy to capture any HTTP and HTTPS traffic from most Windows HTTP clients, including Web Browsers as well as standalone Windows applications and services.

To make this happen, I used Eric Lawrence’s awesome FiddlerCore library, which provides most of the functionality of his desktop Fiddler application, all rolled into an easy to use library that you can plug into your own applications. FiddlerCore makes it almost too easy to capture HTTP content!

For WebSurge I needed to capture all HTTP traffic in order to capture the full HTTP request – URL, headers and any content posted by the client. The result of what I ended up creating is this semi-generic capture form:

CaptureForm

In this post I’m going to demonstrate how easy it is to use FiddlerCore to build this HTTP Capture Form. 

If you want to jump right in here are the links to get Telerik’s Fiddler Core and the code for the demo provided here.

Note that FiddlerCore is bound by a license for commercial usage – see license.txt in the FiddlerCore distribution for details.

Integrating FiddlerCore

FiddlerCore is a library that simply plugs into your application. You can download it from the Telerik site and manually add the assemblies to your project, or you can simply install the NuGet package via:

      PM> Install-Package FiddlerCore

The library consists of the FiddlerCore.dll as well as a couple of support libraries (CertMaker.dll and BCMakeCert.dll) that are used for installing SSL certificates. I’ll have more on SSL captures and certificate installation later in this post.

But first let’s see how easy it is to use FiddlerCore to capture HTTP content by looking at how to build the above capture form.

Capturing HTTP Content

Once the library is installed it’s super easy to hook up Fiddler functionality. Fiddler includes a number of static class methods on the FiddlerApplication object that can be called to hook up callback events as well as actual start monitoring HTTP URLs.

In the following code directly lifted from WebSurge, I configure a few filter options on Form level object, from the user inputs shown on the form by assigning it to a capture options object. In the live application these settings are persisted configuration values, but in the demo they are one time values initialized and set on the form. Once these options are set, I hook up the AfterSessionComplete event to capture every URL that passes through the proxy after the request is completed and start up the Proxy service:

void Start()
{if (tbIgnoreResources.Checked)
        CaptureConfiguration.IgnoreResources = true;elseCaptureConfiguration.IgnoreResources = false;string strProcId = txtProcessId.Text;if (strProcId.Contains('-'))
        strProcId = strProcId.Substring(strProcId.IndexOf('-') + 1).Trim();

    strProcId = strProcId.Trim();

    int procId = 0;if (!string.IsNullOrEmpty(strProcId))
    {if (!int.TryParse(strProcId, out procId))
            procId = 0;
    }
    CaptureConfiguration.ProcessId = procId;
    CaptureConfiguration.CaptureDomain = txtCaptureDomain.Text;FiddlerApplication.AfterSessionComplete += FiddlerApplication_AfterSessionComplete;FiddlerApplication.Startup(8888, true, true, true);
}

The key lines for FiddlerCore are just the last two lines of code that include the event hookup code as well as the Startup() method call. Here I only hook up to the AfterSessionComplete event but there are a number of other events that hook various stages of the HTTP request cycle you can also hook into. Other events include BeforeRequest, BeforeResponse, RequestHeadersAvailable, ResponseHeadersAvailable and so on.

In my case I want to capture the request data and I actually have several options to capture this data. AfterSessionComplete is the last event that fires in the request sequence and it’s the most common choice to capture all request and response data. I could have used several other events, but AfterSessionComplete is one place where you can look both at the request and response data, so this will be the most common place to hook into if you’re capturing content.

The implementation of AfterSessionComplete is responsible for capturing all HTTP request headers and it looks something like this:

private void FiddlerApplication_AfterSessionComplete(Session sess)
{// Ignore HTTPS connect requestsif (sess.RequestMethod == "CONNECT")return;if (CaptureConfiguration.ProcessId > 0)
    {if (sess.LocalProcessID != 0 && sess.LocalProcessID != CaptureConfiguration.ProcessId)return;
    }if (!string.IsNullOrEmpty(CaptureConfiguration.CaptureDomain))
    {if (sess.hostname.ToLower() != CaptureConfiguration.CaptureDomain.Trim().ToLower())return;
    }if (CaptureConfiguration.IgnoreResources)
    {string url = sess.fullUrl.ToLower();var extensions = CaptureConfiguration.ExtensionFilterExclusions;foreach (var ext in extensions)
        {if (url.Contains(ext))return;
        }var filters = CaptureConfiguration.UrlFilterExclusions;foreach (var urlFilter in filters)
        {if (url.Contains(urlFilter))return;
        }
    }if (sess == null || sess.oRequest == null || sess.oRequest.headers == null)return;string headers = sess.oRequest.headers.ToString();var reqBody = sess.GetRequestBodyAsString();// if you wanted to capture the response
    //string respHeaders = session.oResponse.headers.ToString();
    //var respBody = session.GetResponseBodyAsString();

    // replace the HTTP line to inject full URL
    string firstLine = sess.RequestMethod + " " + sess.fullUrl + " " + sess.oRequest.headers.HTTPVersion;int at = headers.IndexOf("\r\n");if (at < 0)return;
    headers = firstLine + "\r\n" + headers.Substring(at + 1);string output = headers + "\r\n" +
                    (!string.IsNullOrEmpty(reqBody) ? reqBody + "\r\n" : string.Empty) +
                    Separator + "\r\n\r\n";BeginInvoke(new Action<string>((text) =>
    {
        txtCapture.AppendText(text);
        UpdateButtonStatus();
    }), output);

}

The code starts by filtering out some requests based on the CaptureOptions I set before the capture is started. These options/filters are applied when requests actually come in. This is very useful to help narrow down the requests that are captured for playback based on options the user picked. I find it useful to limit requests to a certain domain for captures, as well as filtering out some request types like static resources – images, css, scripts etc. This is of course optional, but I think it’s a common scenario and WebSurge makes good use of this feature.

AfterSessionComplete like other FiddlerCore events, provides a Session object parameter which contains all the request and response details. There are oRequest and oResponse objects to hold their respective data. In my case I’m interested in the raw request headers and body only, as you can see in the commented code you can also retrieve the response headers and body. Here the code captures the request headers and body and simply appends the output to the textbox on the screen. Note that the Fiddler events are asynchronous, so in order to display the content in the UI they have to be marshaled back the UI thread with BeginInvoke, which here simply takes the generated headers and appends it to the existing textbox test on the form. As each request is processed, the headers are captured and appended to the bottom of the textbox resulting in a Session HTTP capture in the format that Web Surge internally supports, which is basically raw request headers with a customized 1st HTTP Header line that includes the full URL rather than a server relative URL.

When the capture is done the user can either copy the raw HTTP session to the clipboard, or directly save it to file. This raw capture format is the same format WebSurge and also Fiddler use to import/export request data.

While this code is application specific, it demonstrates the kind of logic that you can easily apply to the request capture process, which is one of the reasonsof why FiddlerCore is so powerful. You get to choose what content you want to look up as part of your own application logic and you can then decide how to capture or use that data as part of your application.

The actual captured data in this case is only a string. The user can edit the data by hand or in the the case of WebSurge, save it to disk and automatically open the captured session as a new load test.

Stopping the FiddlerCore Proxy

Finally to stop capturing requests you simply disconnect the event handler and call the FiddlerApplication.ShutDown() method:

void Stop()
{FiddlerApplication.AfterSessionComplete -= FiddlerApplication_AfterSessionComplete;if (FiddlerApplication.IsStarted())FiddlerApplication.Shutdown();
}

As you can see, adding HTTP capture functionality to an application is very straight forward. FiddlerCore offers tons of features I’m not even touching on here – I suspect basic captures are the most common scenario, but a lot of different things can be done with FiddlerCore’s simple API interface. Sky’s the limit!

The source code for this sample capture form (WinForms) is provided as part of this article.

Adding Fiddler Certificates with FiddlerCore

One of the sticking points in West Wind WebSurge has been that if you wanted to capture HTTPS/SSL traffic, you needed to have the full version of Fiddler and have HTTPS decryption enabled. Essentially you had to use Fiddler to configure HTTPS decryption and the associated installation of the Fiddler local client certificate that is used for local decryption of incoming SSL traffic.

While this works just fine, requiring to have Fiddler installed and then using a separate application to configure the SSL functionality isn’t ideal. Fortunately FiddlerCore actually includes the tools to register the Fiddler Certificate directly using FiddlerCore.

Why does Fiddler need a Certificate in the first Place?

Fiddler and FiddlerCore are essentially HTTP proxies which means they inject themselves into the HTTP conversation by re-routing HTTP traffic to a special HTTP port (8888 by default for Fiddler) and then forward the HTTP data to the original client. Fiddler injects itself as the system proxy in using the WinInet Windows settings  which are the same settings that Internet Explorer uses and that are configured in the Windows and Internet Explorer Internet Settings dialog. Most HTTP clients running on Windows pick up and apply these system level Proxy settings before establishing new HTTP connections and that’s why most clients automatically work once Fiddler – or FiddlerCore/WebSurge are running.

For plain HTTP requests this just works – Fiddler intercepts the HTTP requests on the proxy port and then forwards them to the original port (80 for HTTP and 443 for SSL typically but it could be any port). For SSL however, this is not quite as simple – Fiddler can easily act as an HTTPS/SSL client to capture inbound requests from the server, but when it forwards the request to the client it has to also act as an SSL server and provide a certificate that the client trusts. This won’t be the original certificate from the remote site, but rather a custom local certificate that effectively simulates an SSL connection between the proxy and the client. If there is no custom certificate configured for Fiddler the SSL request fails with a certificate validation error. The key for this to work is that a custom certificate has to be installed that the HTTPS client trusts on the local machine.

For a much more detailed description of the process you can check out Eric Lawrence’s blog post on Certificates.

If you’re using the desktop version of Fiddler you can install a local certificate into the Windows certificate store. Fiddler proper does this from the Options menu:

FiddlerDecrypt

This operation does several things:

  • It installs the Fiddler Root Certificate
  • It sets trust to this Root Certificate
  • A new client certificate is generated for each HTTPS site monitored

Certificate Installation with FiddlerCore

You can also provide this same functionality using FiddlerCore which includes a CertMaker class. Using CertMaker is straight forward to use and it provides an easy way to create some simple helpers that can install and uninstall a Fiddler Root certificate:

public static bool InstallCertificate()
{if (!CertMaker.rootCertExists())
    {if (!CertMaker.createRootCert())return false;if (!CertMaker.trustRootCert())return false;
    }return true;
}public static bool UninstallCertificate()
{if (CertMaker.rootCertExists())
    {if (!CertMaker.removeFiddlerGeneratedCerts(true))return false;
    }return true;
}

InstallCertificate() works by first checking whether the root certificate is already installed and if it isn’t goes ahead and creates a new one. The process of creating the certificate is a two step process – first the actual certificate is created and then it’s moved into the certificate store to become trusted. I’m not sure why you’d ever split these operations up since a cert created without trust isn’t going to be of much value, but there are two distinct steps.

When you trigger the trustRootCert() method, a message box will pop up on the desktop that lets you know that you’re about to trust a local private certificate. This is a security feature to ensure that you really want to trust the Fiddler root since you are essentially installing a man in the middle certificate. It’s quite safe to use this generated root certificate, because it’s been specifically generated for your machine and thus is not usable from external sources, the only way to use this certificate in a trusted way is from the local machine. IOW, unless somebody has physical access to your machine, there’s no useful way to hijack this certificate and use it for nefarious purposes (see Eric’s post for more details).

Once the Root certificate has been installed, FiddlerCore/Fiddler create new certificates for each site that is connected to with HTTPS. You can end up with quite a few temporary certificates in your certificate store. To uninstall you can either use Fiddler and simply uncheck the Decrypt HTTPS traffic option followed by the remove Fiddler certificates button, or you can use FiddlerCore’s CertMaker.removeFiddlerGeneratedCerts() which removes the root cert and any of the intermediary certificates Fiddler created.

Keep in mind that when you uninstall you uninstall the certificate for both FiddlerCore and Fiddler, so use UninstallCertificate() with care and realize that you might affect the Fiddler application’s operation by doing so as well.

When to check for an installed Certificate

Note that the check to see if the root certificate exists is pretty fast, while the actual process of installing the certificate is a relatively slow operation that even on a fast machine takes a few seconds. Further the trust operation pops up a message box so you probably don’t want to install the certificate repeatedly.

Since the check for the root certificate is fast, you can easily put a call to InstallCertificate() in any capture startup code – in which case the certificate installation only triggers when a certificate is in fact not installed.

Personally I like to make certificate installation explicit – just like Fiddler does, so in WebSurge I use a small drop down option on the menu to install or uninstall the SSL certificate:

InstallCertificate 

This code calls the InstallCertificate and UnInstallCertificate functions respectively – the experience with this is similar to what you get in Fiddler with the extra dialog box popping up to prompt confirmation for installation of the root certificate. Once the cert is installed you can then capture SSL requests.

There’s a gotcha however…

Gotcha: FiddlerCore Certificates don’t stick by Default

When I originally tried to use the Fiddler certificate installation I ran into an odd problem. I was able to install the certificate and immediately after installation was able to capture HTTPS requests. Then I would exit the application and come back in and try the same HTTPS capture again and it would fail due to a missing certificate. CertMaker.rootCertExists() would return false after every restart and if re-installed the certificate a new certificate would get added to the certificate store resulting in a bunch of duplicated root certificates with different keys.

What the heck?

CertMaker and BcMakeCert create non-sticky Certificates
I turns out that FiddlerCore by default uses different components from what the full version of Fiddler uses. Fiddler uses a Windows utility called MakeCert.exe to create the Fiddler Root certificate. FiddlerCore however installs the CertMaker.dll and BCMakeCert.dll assemblies, which use a different crypto library (Bouncy Castle) for certificate creation than MakeCert.exe which uses the Windows Crypto API. The assemblies provide support for non-windows operation for Fiddler under Mono, as well as support for some non-Windows certificate platforms like iOS and Android for decryption.

The bottom line is that the FiddlerCore provided bouncy castle assemblies are not sticky by default as the certificates created with them are not cached as they are in Fiddler proper. To get certificates to ‘stick’ you have to explicitly cache the certificates in Fiddler’s internal preferences.

A cache aware version of InstallCertificate looks something like this:

public static bool InstallCertificate()
{if (!CertMaker.rootCertExists())           
    {if (!CertMaker.createRootCert())return false;if (!CertMaker.trustRootCert())return false;App.Configuration.UrlCapture.Cert = 
FiddlerApplication.Prefs.GetStringPref("fiddler.certmaker.bc.cert", null);App.Configuration.UrlCapture.Key =
FiddlerApplication.Prefs.GetStringPref("fiddler.certmaker.bc.key", null); }return true; }public static bool UninstallCertificate() {if (CertMaker.rootCertExists()) {if (!CertMaker.removeFiddlerGeneratedCerts(true))return false; }App.Configuration.UrlCapture.Cert = null;App.Configuration.UrlCapture.Key = null;return true; }

In this code I store the Fiddler cert and private key in an application configuration settings that’s stored with the application settings (App.Configuration.UrlCapture object). These settings automatically persist when WebSurge is shut down. The values are read out of Fiddler’s internal preferences store which is set after a new certificate has been created. Likewise I clear out the configuration settings when the certificate is uninstalled.

In order for these setting to be used you have to also load the configuration settings into the Fiddler preferences *before* a call to rootCertExists() is made. I do this in the capture form’s constructor:

public FiddlerCapture(StressTestForm form) { InitializeComponent(); CaptureConfiguration = App.Configuration.UrlCapture; MainForm = form;if (!string.IsNullOrEmpty(App.Configuration.UrlCapture.Cert)) {FiddlerApplication.Prefs.SetStringPref("fiddler.certmaker.bc.key", App.Configuration.UrlCapture.Key);FiddlerApplication.Prefs.SetStringPref("fiddler.certmaker.bc.cert", App.Configuration.UrlCapture.Cert);
}
}

This is kind of a drag to do and not documented anywhere that I could find, so hopefully this will save you some grief if you want to work with the stock certificate logic that installs with FiddlerCore.

MakeCert provides sticky Certificates and the same functionality as Fiddler

But there’s actually an easier way. If you want to skip the above Fiddler preference configuration code in your application you can choose to distribute MakeCert.exe instead of certmaker.dll and bcmakecert.dll. When you use MakeCert.exe, the certificates settings are stored in Windows so they are available without any custom configuration inside of your application. It’s easier to integrate and as long as you run on Windows and you don’t need to support iOS or Android devices is simply easier to deal with.

To integrate into your project, you can remove the reference to CertMaker.dll (and the BcMakeCert.dll assembly) from your project. Instead copy MakeCert.exe into your output folder. To make sure MakeCert.exe gets pushed out, include MakeCert.exe in your project and set the Build Action to None, and Copy to Output Directory to Copy if newer.

CopyToOutput

Note that the CertMaker.dll reference in the project has been removed and on disk the files for Certmaker.dll, as well as the BCMakeCert.dll files on disk. Keep in mind that these DLLs are resources of the FiddlerCore NuGet package, so updating the package may end up pushing those files back into your project. Once MakeCert.exe is distributed FiddlerCore checks for it first before using the assemblies so as long as MakeCert.exe exists it’ll be used for certificate creation (at least on Windows).

Summary

FiddlerCore is a pretty sweet tool, and it’s absolutely awesome that we get to plug in most of the functionality of Fiddler right into our own applications. A few years back I tried to build this sort of functionality myself for an app and ended up giving up because it’s a big job to get HTTP right – especially if you need to support SSL. FiddlerCore now provides that functionality as a turnkey solution that can be plugged into your own apps easily.

The only downside is FiddlerCore’s documentation for more advanced features like certificate installation which is pretty sketchy. While for the most part FiddlerCore’s feature set is easy to work with without any documentation, advanced features are often not intuitive to gleam by just using Intellisense or the FiddlerCore help file reference (which is not terribly useful). While Eric Lawrence is very responsive on his forum and on Twitter, there simply isn’t much useful documentation on Fiddler/FiddlerCore available online. If you run into trouble the forum is probably the first place to look and then ask a question if you can’t find the answer.

The best documentation you can find is Eric’s Fiddler Book which covers a ton of functionality of Fiddler and FiddlerCore. The book is a great reference to Fiddler’s feature set as well as providing great insights into the HTTP protocol. The second half of the book that gets into the innards of HTTP is an excellent read for anybody who wants to know more about some of the more arcane aspects and special behaviors of HTTP – it’s well worth the read. While the book has tons of information in a very readable format, it’s unfortunately not a great reference as it’s hard to find things in the book and because it’s not available online you can’t electronically search for the great content in it.

But it’s hard to complain about any of this given the obvious effort and love that’s gone into this awesome product for all of these years. A mighty big thanks to Eric Lawrence  for having created this useful tool that so many of us use all the time, and also to Telerik for picking up Fiddler/FiddlerCore and providing Eric the resources to support and improve this wonderful tool full time and keeping it free for all. Kudos!

Resources

© Rick Strahl, West Wind Technologies, 2005-2014
Posted in .NET  HTTP  

The broken Promise of the Mobile Web

$
0
0

brokenphoneHigh end mobile devices have been with us now for almost 7 years and they have utterly transformed the way we access information. Mobile phones and smartphones that have access to the Internet and host smart applications are in the hands of a large percentage of the population of the world. In many places even very remote, cell phones and even smart phones are a common sight.

I’ll never forget when I was in India in 2011 I was up in the Southern Indian mountains riding an elephant out of a tiny local village, with an elephant herder in front riding atop of the elephant in front of us. He was dressed in traditional garb with the loin wrap and head cloth/turban as did quite a few of the locals in this small out of the way and not so touristy village. So we’re slowly trundling along in the forest and he’s lazily using his stick to guide the elephant and… 10 minutes in he pulls out his cell phone from his sash and starts texting. In the middle of texting a huge pig jumps out from the side of the trail and he takes a picture running across our path in the jungle! So yeah, mobile technology is very pervasive and it’s reached into even very buried and unexpected parts of this world.

Apps are still King

Apps currently rule the roost when it comes to mobile devices and the applications that run on them. If there’s something that you need on your mobile device your first step usually is to look for an app, not use your browser. But native app development remains a pain in the butt, with the requirement to have to support 2 or 3 completely separate platforms.

There are solutions that try to bridge that gap. Xamarin is on a tear at the moment, providing their cross-device toolkit to build applications using C#. While Xamarin tools are impressive – and also *very* expensive – they only address part of the development madness that is app development. There are still specific device integration isssues, dealing with the different developer programs, security and certificate setups and all that other noise that surrounds app development.

There’s also PhoneGap/Cordova which provides a hybrid solution that involves creating local HTML/CSS/JavaScript based applications, and then packaging them to run in a specialized App container that can run on most mobile device platforms using a WebView interface. This allows for using of HTML technology, but it also still requires all the set up, configuration of APIs, security keys and certification and submission and deployment process just like native applications – you actually lose many of the benefits that  Web based apps bring. The big selling point of Cordova is that you get to use HTML have the ability to build your UI once for all platforms and run across all of them – but the rest of the app process remains in place.

Apps can be a big pain to create and manage especially when we are talking about specialized or vertical business applications that aren’t geared at the mainstream market and that don’t fit the ‘store’ model. If you’re building a small intra department application you don’t want to deal with multiple device platforms and certification etc. for various public or corporate app stores. That model is simply not a good fit both from the development and deployment perspective.

Even for commercial, big ticket apps, HTML as a UI platform offers many advantages over native, from write-once run-anywhere, to remote maintenance, single point of management and failure to having full control over the application as opposed to have the app store overloads censor you.

In a lot of ways Web based HTML/CSS/JavaScript applications have so much potential for building better solutions based on existing Web technologies for the very same reasons a lot of content years ago moved off the desktop to the Web.

To me the Web as a mobile platform makes perfect sense, but the reality of today’s Mobile Web unfortunately looks a little different…

Where’s the Love for the Mobile Web?

Yet here we are in the middle of 2014, nearly 7 years after the first iPhone was released and brought the promise of rich interactive information at your fingertips, and yet we still don’t really have a solid mobile Web platform.

I know what you’re thinking: “But we have lots of HTML/JavaScript/CSS features that allows us to build nice mobile interfaces”. I agree to a point – it’s actually quite possible to build nice looking, rich and capable Web UI today. We have media queries to deal with varied display sizes, CSS transforms for smooth animations and transitions, tons of CSS improvements in CSS 3 that facilitate rich layout, a host of APIs geared towards mobile device features and lately even a number of JavaScript framework choices that facilitate development of multi-screen apps in a consistent manner.

Personally I’ve been working a lot with AngularJs and heavily modified Bootstrap themes to build mobile first UIs and that’s been working very well to provide highly usable and attractive UI for typical mobile business applications. From the pure UI perspective things actually look very good.

Not just about the UI

But it’s not just about the UI - it’s also about integration with the mobile device. When it comes to putting all those pieces together into what amounts to a consolidated platform to build mobile Web applications, I think we still have a ways to go… there are a lot of missing pieces to make it all work together and integrate with the device more smoothly, and more importantly to make it work uniformly across the majority of devices.

I think there are a number of reasons for this.

Slow Standards Adoption

HTML standards implementations and ratification has been dreadfully slow, and browser vendors all seem to pick and choose different pieces of the technology they implement. The end result is that we have a capable UI platform that’s missing some of the infrastructure pieces to make it whole on mobile devices. There’s lots of potential but what is lacking that final 10% to build truly compelling mobile applications that can compete favorably with native applications.

mobileweblogSome of it is the fragmentation of browsers and the slow evolution of the mobile specific HTML APIs. A host of mobile standards exist but many of the standards are in the early review stage and they have been there stuck for long periods of time and seem to move at a glacial pace. Browser vendors seem even slower to implement them, and for good reason – non-ratified standards mean that implementations may change and vendor implementations tend to be experimental and  likely have to be changed later. Neither Vendors or developers are not keen on changing standards. This is the typical chicken and egg scenario, but without some forward momentum from some party we end up stuck in the mud. It seems that either the standards bodies or the vendors need to carry the torch forward and that doesn’t seem to be happening quickly enough.

Mobile Device Integration just isn’t good enough

Current standards are not far reaching enough to address a number of the use case scenarios necessary for many mobile applications. While not every application needs to have access to all mobile device features, almost every mobile application could benefit from some integration with other parts of the mobile device platform. Integration with GPS, phone, media, messaging, notifications, linking and contacts system are benefits that are unique to mobile applications and could be widely used, but are mostly (with the exception of GPS) inaccessible for Web based applications today.

Unfortunately trying to do most of this today only with a mobile Web browser is a losing battle. Aside from PhoneGap/Cordova’s app centric model with its own custom API accessing mobile device features and the token exception of the GeoLocation API, most device integration features are not widely supported by the current crop of mobile browsers. For example there’s no usable messaging API that allows access to SMS or contacts from HTML. Even obvious components like the Media Capture API are only implemented partially by mobile devices. There are alternatives and workarounds for some of these interfaces by using browser specific code, but that’s might ugly and something that I thought we were trying to leave behind with newer browser standards. But it’s not quite working out that way.

It’s utterly perplexing to me that mobile standards like Media Capture and Streams, Media Gallery Access, Responsive Images, Messaging API, Contacts Manager API have only minimal or no traction at all today. Keep in mind we’ve had mobile browsers for nearly 7 years now, and yet we still have to think about how to get access to an image from the image gallery or the camera on some devices? Heck Windows Phone IE Mobile just gained the ability to upload images recently in the Windows 8.1 Update – that’s feature that HTML has had for 20 years! These are simple concepts and common problems that should have been solved a long time ago.

It’s extremely frustrating to see build 90% of a mobile Web app with relative ease and then hit a brick wall for the remaining 10%, which often can be show stoppers. The remaining 10% have to do with platform integration, browser differences and working around the limitations that browsers and ‘pinned’ applications impose on HTML applications.

The maddening part is that these limitations seem arbitrary as they could easily work on all mobile platforms. For example, SMS has a URL Moniker interface that sort of works on Android, works badly with iOS (only works if the address is already in the contact list) and not at all on Windows Phone. There’s no reason this shouldn’t work universally using the same interface – after all all phones have supported SMS since before the year 2000!

But, it doesn’t have to be this way

Change canhappen very quickly. Take the GeoLocation API for example. Geolocation has taken off at the very beginning of the mobile device era and today it works well, provides the necessary security (a big concern for many mobile APIs), and is supported by just about all major mobile and even desktop browsers today. It handles security concerns via prompts to avoid unwanted access which is a model that would work for most other device APIs in a similar fashion. One time approval and occasional re-approval if code changes or caches expire. Simple and only slightly intrusive. It all works well, even though GeoLocation actually has some physical limitations, such as representing the current location when no GPS device is present. Yet this is a solved problem, where other APIs that are conceptually much simpler to implement have failed to gain any traction at all.

Technically none of these APIs should be a problem to implement, but it appears that the momentum is just not there.

Inadequate Web Application Linking and Activation

Another important piece of the puzzle missing is the integration of HTML based Web applications. Today HTML based applications are not first class citizens on mobile operating systems.

When talking about HTML based content there’s a big difference between content and applications. Content is great for search engine discovery and plain browser usage. Content is usually accessed intermittently and permanent linking is not so critical for this type of content.  But applications have different needs. Applications need to be started up quickly and must be easily switchable to support a multi-tasking user workflow. Therefore, it’s pretty crucial that mobile Web apps are integrated into the underlying mobile OS and work with the standard task management features. Unfortunately this integration is not as smooth as it should be.

It starts with actually trying to find mobile Web applications, to ‘installing’ them onto a phone in an easily accessible manner in a prominent position. The experience of discovering a Mobile Web ‘App’ and making it sticky is by no means as easy or satisfying. Today the way you’d go about this is:

  • Open the browser
  • Search for a Web Site in the browser with your
    search engine of choice
  • Hope that you find the right site
  • Hope that you actually find a site that works for your mobile device
  • Click on the link and run the app in a fully chrome’d browser instance (read tiny surface area)
  • Pin the app to the home screen (with all the limitations outline above)
  • Hope you pointed at the right URL when you pinned

Even for you and me as developers, there are a few steps in there that are painful and annoying, but think about the average user. First figuring out how to search for a specific site or URL? And then pinning the app and hopefully from the right location? You’ve probably lost more than half of your audience at that point.

This experience sucks.

For developers too this process is painful since app developers can’t control the shortcut creation directly. This problem often gets solved by crazy coding schemes, with annoying pop-ups that try to get people to create shortcuts via fancy animations that are both annoying and add overhead to each and every application that implements this sort of thing differently.

And that’s not the end of it - getting the link onto the home screen with an application icon varies quite a bit between browsers. Apple’s non-standard meta tags are prominent and they work with iOS and Android (only more recent versions), but not on Windows Phone. Windows Phone instead requires you to create an actual screen or rather a partial screen be captured for a shortcut in the tile manager. Who had that brilliant idea I wonder? Surprisingly Chrome on recent Android versions seems to actually get it right – icons use pngs, pinning is easy and pinned applications properly behave like standalone apps and retain the browser’s active page state and content. Each of the platforms has a different way to specify icons (WP doesn’t allow you to use an icon image at all), and the most widely used interface in use today is a bunch of Apple specific meta tags that other browsers choose to support.

The question is: Why is there no standard implementation for installing shortcuts across mobile platforms using an official format rather than a proprietary one?

iPhoneSwapThen there’s iOS and the crazy way it treats home screen linked URLs using a crazy hybrid format that is neither as capable as a Web app running in Safari nor a WebView hosted application. Moving off the Web ‘app’ link when switching to another app actually causes the browser and preview it to ‘blank out’ the Web application in the Task View (see screenshot on the right). Then, when the ‘app’ is reactivated it ends up completely restarting the browser with the original link. This is crazy behavior that you can’t easily work around. In some situations you might be able to store the application state and restore it using LocalStorage, but for many scenarios that involve complex data sources (like say Google Maps) that’s not a possibility. The only reason for this screwed up behavior I can think of is that it is deliberate to make Web apps a pain in the butt to use and forcing users trough the App Store/PhoneGap/Cordova route.

App linking and management is a very basic problem – something that we essentially have solved in every desktop browser – yet on mobile devices where it arguably matters a lot more to have easy access to web content we have to jump through hoops to have even a remotely decent linking/activation experience across browsers.

Where’s the Money?

It’s not surprising that device home screen integration and Mobile Web support in general is in such dismal shape – the mobile OS vendors benefit financially from App store sales and have little to gain from Web based applications that bypass the App store and the cash cow that wheresmymoneyit presents.

On top of that, platform specific vendor lock-in of both end users and developers who have invested in hardware, apps and consumables is something that mobile platform vendors actually aspire to. Web based interfaces that are cross-platform are the anti-thesis of that and so again it’s no surprise that the mobile Web is on a struggling path.

But – that may be changing. More and more we’re seeing operations shifting to services that are subscription based or otherwise collect money for usage, and that may drive more progress into the Web direction in the end . Nothing like the almighty dollar to drive innovation forward.

Do we need a Mobile Web App Store?

As much as I dislike moderated experiences in today’s massive App Stores, they do at least provide one single place to look for apps for your device.

I think we could really use some sort of registry, that could provide something akin to an app store for mobile Web apps, to make it easier to actually find mobile applications. This could take the form of a specialized search engine, or maybe a more formal store/registry like structure. Something like apt-get/chocolatey for Web apps. It could be curated and provide at least some feedback and reviews that might help with the integrity of applications.

Coupled to that could be a native application on each platform that would allow searching and browsing of the registry and then also handle installation in the form of providing the home screen linking, plus maybe an initial security configuration that determines what features are allowed access to for the app.

I’m not holding my breath. In order for this sort of thing to take off and gain widespread appeal, a lot of coordination would be required. And in order to get enough traction it would have to come from a well known entity – a mobile Web app store from a no name source is unlikely to gain high enough usage numbers to make a difference. In a way this would eliminate some of the freedom of the Web, but of course this would also be an optional search path in addition to the standard open Web search mechanisms to find and access content today.

Security

Security is a big deal, and one of the perceived reasons why so many IT professionals appear to be willing to go back to the walled garden of deployed apps is that Apps are perceived as safe due to the official review and curation of the App stores. Curated stores are supposed to protect you from malware, illegal and misleading content. It doesn’t always work out that way and all the major vendors have had issues with security and the review process at some time or another.

Security is critical, but I also think that Web applications in general pose less of a security threat than native applications, by nature of the sandboxed browser and JavaScript environments. Web applications run externally completely and in the HTML and JavaScript sandboxes, with only a very few controlled APIs allowing access to device specific features.

And as discussed earlier – security for any device interaction can be granted the same for mobile applications through a Web browser, as they can for native applications either via explicit policies loaded from the Web, or via prompting as GeoLocation does today. Security is important, but it’s certainly solvable problem for Web applications even those that need to access device hardware.

Security shouldn’t be a reason for Web apps to be an equal player in mobile applications.

Apps are winning, but haven’t we been here before?

So now we’re finding ourselves back in an era of installed app, rather than Web based and managed apps. Only it’s even worse today than with Desktop applications, in that the apps are going through a gatekeeper that charges a toll and censors what you can and can’t do in your apps. Frankly it’s a mystery to me why anybody would buy into this model and why it’s lasted this long when we’ve already been through this process. It’s crazy…

It’s really a shame that this regression is happening. We have the technology to make mobile Web apps much more prominent, but yet we’re basically held back by what seems little more than bureaucracy, partisan bickering and self interest of the major parties involved. Back in the day of the desktop it was Internet Explorer’s 98+%  market shareholding back the Web from improvements for many years – now it’s the combined mobile OS market in control of the mobile browsers.

If mobile Web apps were allowed to be treated the same as native apps with simple ways to install and run them consistently and persistently, that would go a long way to making mobile applications much more usable and seriously viable alternatives to native apps. But as it is mobile apps have a severe disadvantage in placement and operation.

There are a few bright spots in all of this.

Mozilla’s FireFoxOs is embracing the Web for it’s mobile OS by essentially firefoxosbuilding every app out of HTML and JavaScript based content. It supports both packaged and certified package modes (that can be put into the app store), and Open Web apps that are loaded and run completely off the Web and can also cache locally for offline operation using a manifest. Open Web apps are treated as full class citizens in FireFoxOS and run using the same mechanism as installed apps.

Unfortunately FireFoxOs is getting a slow start with minimal device support and specifically targeting the low end market. We can hope that this approach will change and catch on with other vendors, but that’s also an uphill battle given the conflict of interest with platform lock in that it represents.

Recent versions of Android also seem to be working reasonably well with mobile application integration onto the desktop and activation out of the box. Although it still uses the Apple meta tags to find icons and behavior settings, everything at least works as you would expect – icons to the desktop on pinning, WebView based full screen activation, and reliable application persistence as the browser/app is treated like a real application. Hopefully iOS will at some point provide this same level of rudimentary Web app support.

What’s also interesting to me is that Microsoft hasn’t picked up on the obvious need for a solid Web App platform. Being a distant third in the mobile OS war, Microsoft certainly has nothing to lose and everything to gain by using fresh ideas and expanding into areas that the other major vendors are neglecting. But instead Microsoft is trying to beat the market leaders at their own game, fighting on their adversary’s terms instead of taking a new tack. Providing a kick ass mobile Web platform that takes the lead on some of the proposed mobile APIs would be something positive that Microsoft could do to improve its miserable position in the mobile device market.

Where are we at with Mobile Web?

It sure sounds like I’m really down on the Mobile Web, right? I’ve built a number of mobile apps in the last year and while overall result and response has been very positive to what we were able to accomplish in terms of UI, getting that final 10% that required device integration dialed was an absolute nightmare on every single one of them. Big compromises had to be made and some features were left out or had to be modified for some devices. In two cases we opted to go the Cordova route in order to get the integration we needed, along with the extra pain involved in that process. Unless you’re not integrating with device features and you don’t care deeply about a smooth integration with the mobile desktop, mobile Web development is fraught with frustration.

So, yes I’m frustrated! But it’s not for lack of wanting the mobile Web to succeed. I am still a firm believer that we will eventually arrive a much more functional mobile Web platform that allows access to the most common device features in a sensible way.

It wouldn't be difficult for device platform vendors to make Web based applications first class citizens on mobile devices.

But unfortunately it looks like it will still be some time before this happens.

changecanhappen

So, what’s your experience building mobile Web apps? Are you finding similar issues? Just giving up on raw Web applications and building PhoneGap apps instead? Completely skipping the Web and going native? Leave a comment for discussion.

Resources

© Rick Strahl, West Wind Technologies, 2005-2014
Posted in HTML5  Mobile  

A .NET QueryString and Form Data Parser

$
0
0

Querystring and form data parsing and editing is something that I seem to run into from time to time in non-Web applications. Actually, it’s easy enough to do simple parsing in Web applications that use System.Web using the HttpUtility.ParseQueryString() method or simply using HttpWebRequest’s methods. If you’re inside of an ASP.NET Web app, see the end of this article.

But if you’re not working within the scope of System.Web, there’s not a ton of support for manipulating form data or query string values via code. Heck it’s a pain even in ASP.NET Web API or SignalR if you’re self or OWIN hosting,  where there’s no real interface to create or even easily read raw form and query string data. For client side applications in particular the lack of this functionality can be a pain. I’ve been guilty of adding System.Web from time to time just for this functionality, which is not a good idea due to the sheer size of System.Web.

It makes you wonder why this sort of functionality isn’t provided natively in the base framework in System.NET since it’s needed for all sorts of client side HTTP scenarios, from constructing client side requests with HttpWebRequest to server side manipulation of URLs, or even using the frameworks that don’t have built in parsing and update support. Even the new HttpClient class doesn’t have good support for form data creation although it can at least be done. Either way I’ve run into having to manipulate url encoded often enough that it’s gotten me to do something about it.

To wit, currently I’m working on West Wind WebSurge and one useful feature improvement request I’ve had is to add the ability to override provided query string parameters with custom query string key/value pairs provided by the user when a test is run. Internally I use HttpWebRequest to fire previously captured requests, and each request is filtered/modified based on a number of request modifiers that can be set. For querystring values this is useful for changing fixed ids or ‘license plate’/token query string parameters when the URL executes to match a specific user context. You can also change other things like Cookies or Authentication headers, but that’s not part of this discussion here.

A UrlEncodingParser Class

I’ve  needed to parse, write or update querystrings or form data a few times before and because it’s not exactly rocket science I’ve usually in-lined a bit of code that handles the simple things I needed to do – it worked but it’s ugly. Well, no more! This time I decided to fix this once and for all by creating a small helper class that handles this problem more generically.

The class does the following:

  • Takes raw Query String or Form data as input
  • Optionally allows a full URL as input – if a URL is passed the query string data is modified
  • Allows reading of values by key
  • Allows reading of multiple values for a key
  • Allows modifying and adding of keys
  • Allows for setting multiple values for a single key
  • Allows writing modified data out to raw data or a URL if a URL was originally provided

This is perfect for URL injection or for applications that need to build up raw HTTP form data to post to a server.

Using UrlEncodingParser

This class is based on the NameValueCollection class, which is also used by System.Web’s various key value collections like QueryString, Form and Headers. One of the unique things about this collection class is that it’s optimized for fast retrieval and explicitly supports multiple values per key.

My simple implementation of UrlEncodingParser subclasses NameValueCollection and adds the ability to parse an existing urlencoded string or full URL into it, allows for modification including adding multi-values for keys, and then can output the urlencoded data including a full URL if one was passed in using ToString().

Because of the reuse of NVC using UrlEncodingParser should feel familiar. Here’s is an example:

[TestMethod]public void QueryStringTest()
{string str = "http://mysite.com/page1?id=3123&format=json&action=edit&text=It's%20a%20brave%20new%20world!";var query = new UrlEncodingParser(str);Assert.IsTrue(query["id"] == "3123");Assert.IsTrue(query["format"] == "json","wrong format " + query["format"]);Assert.IsTrue(query["action"] == "edit");Console.WriteLine(query["text"]);// It's a brave new world!query["id"] = "4123";
    query["format"] = "xml"; 
    query["name"] = "<< It's a brave new world!";var url = query.ToString();Console.WriteLine(url);//http://mysite.com/page1?id=4123&format=xml&action=edit&
    //text=It's%20a%20brave%20new%20world!&name=%3C%3C%20It's%20a%20brave%20new%20world!}

This code passes in a full URL, checks the input values, then modifies and adds one, then writes out the modified URL to a new string. I’m using a URL here which allows preserves the original base URL and simply appends the new/modified query string. But you could also pass the raw URL encoded data/querystring in which case you get just that data back.

The parser also supports multiple values per key, since that’s a supported feature for Form variables at least (not for query strings though).

[TestMethod]public void QueryStringMultipleTest()
{string str = "http://mysite.com/page1?id=3123&format=json&format=xml";var query = new UrlEncodingParser(str);Assert.IsTrue(query["id"] == "3123");Assert.IsTrue(query["format"] == "json,xml", "wrong format " + query["format"]);Console.WriteLine(query["text"]);// multiple format stringsstring[] formats = query.GetValues("format");Assert.IsTrue(formats.Length == 2);

    query.SetValues("multiple", new[]
    {"1","2","3"});var url = query.ToString();Console.WriteLine(url);Assert.IsTrue(url =="http://mysite.com/page1?id=3123&format=json&format=xml&multiple=1&multiple=2&multiple=3");
}

Show me the Code

The implementation of this simple class is straightforward, although I ended up experimenting a bit with various dictionary types before I realized that I had to support multiple values per key in order to support Form data, which led me to the NameValueCollection class. The beauty of that is that very little code is required as the key/value management is completely handle by the base – I only had to add parsing a couple of specialty overrides.

Here’s the complete code (you can also find the code on Github):

/// <summary>
/// A query string or UrlEncoded form parser and editor /// class that allows reading and writing of urlencoded/// key value pairs used for query string and HTTP /// form data./// 
/// Useful for parsing and editing querystrings inside/// of non-Web code that doesn't have easy access to/// the HttpUtility class.                /// </summary>
/// <remarks>
/// Supports multiple values per key/// </remarks>public class UrlEncodingParser : NameValueCollection{/// <summary>
    /// Holds the original Url that was assigned if any/// Url must contain // to be considered a url/// </summary>private string Url { get; set; }/// <summary>
    /// Always pass in a UrlEncoded data or a URL to parse from/// unless you are creating a new one from scratch./// </summary>
    /// <param name="queryStringOrUrl">
    /// Pass a query string or raw Form data, or a full URL./// If a URL is parsed the part prior to the ? is stripped/// but saved. Then when you write the original URL is /// re-written with the new query string./// </param>public UrlEncodingParser(string queryStringOrUrl = null)
    {
        Url = string.Empty;if (!string.IsNullOrEmpty(queryStringOrUrl))
        {
            Parse(queryStringOrUrl);
        }
    }/// <summary>
    /// Assigns multiple values to the same key/// </summary>
    /// <param name="key"></param>
    /// <param name="values"></param>public void SetValues(string key, IEnumerable<string> values)
    {foreach (var val in values)
            Add(key, val);
    }/// <summary>
    /// Parses the query string into the internal dictionary/// and optionally also returns this dictionary/// </summary>
    /// <param name="query">
    /// Query string key value pairs or a full URL. If URL is/// passed the URL is re-written in Write operation/// </param>
    /// <returns></returns>public NameValueCollection Parse(string query)
    {if (Uri.IsWellFormedUriString(query,UriKind.Absolute))
            Url = query;if (string.IsNullOrEmpty(query))
            Clear();else{int index = query.IndexOf('?');if (index > -1)
            {if (query.Length >= index + 1)
                    query = query.Substring(index + 1);
            }var pairs = query.Split('&');foreach (var pair in pairs)
            {int index2 = pair.IndexOf('=');if (index2 > 0)
                {
                    Add(pair.Substring(0, index2), pair.Substring(index2 + 1));
                }
            }
        }return this;
    }/// <summary>
    /// Writes out the urlencoded data/query string or full URL based /// on the internally set values./// </summary>
    /// <returns>urlencoded data or url</returns>public override string ToString()
    {string query = string.Empty;foreach (string key in Keys)
        {string[] values = GetValues(key);foreach (var val in values)
            {
                query += key + "=" + Uri.EscapeUriString(val) + "&";
            }
        }
        query = query.Trim('&');if (!string.IsNullOrEmpty(Url))
        {if (Url.Contains("?"))
                query = Url.Substring(0, Url.IndexOf('?') + 1) + query;elsequery = Url + "?" + query;
        }return query;
    }
}

Short and simple – makes you wonder why this isn’t built into the core framework, right?

This code is self-contained so you can just paste it into your app, or you can get it as part of the Westwind.Utilities library from Nuget.

Applying it in my App

So inside of WebSurge I need to do URL replacement and it’s a cinch to do now by simply reading the original URL and its query string parameters and updating it with values from the list that the user provided.

The helper function that does this looks like this:

private string ReplaceQueryStringValuePairs(string url, string replaceKeys)
{if (string.IsNullOrEmpty(replaceKeys))return url;var urlQuery = new UrlEncodingParser(url);var replaceQuery = new UrlEncodingParser(replaceKeys);foreach (string key in replaceQuery.Keys)
    {
        urlQuery[key] = replaceQuery[key];
    }return urlQuery.ToString();
}

Notice that this routine passes in a full URL and the URL is preserved by the parser which is a nice bonus feature and avoids having to deal with the logic of extracting and then re-appending the query string reliably with or without the ? required, which makes the app level code much cleaner.

If using System.Web, you can use HttpUtility

As I mentioned at the beginning if you’re inside of the context of a Web application you can easily use the HttpUtility class and it the ParseQueryString() method which provides you with a NameValueCollection that provides most of the same functionality. It won’t parse existing URLs and return them to you, but it will let you manage the actual UrlEncoded data.

Here’s an example of manipulating raw data similar to what I showed earlier:

var str = "id=123312&action=edit&format=json";var query = HttpUtility.ParseQueryString(str);
query["Lang"] = "en";
query["format"] = "xml";Console.WriteLine(query.ToString());
// id=123312&action=edit&format=xml&Lang=en

You can also create an empty collection that you can add to with:

var query = HttpUtility.ParseQueryString("");

It’s just a bummer that these general formatting routines are tied up in System.Web, rather than in System.Net with all the rest of the URI related formatting where it belongs. Well, maybe in the future.

In the meantime the above helper class is a way to easily add this functionality to your non-Web apps. Hope some of you find this useful.

Resources

© Rick Strahl, West Wind Technologies, 2005-2014
Posted in .NET  ASP.NET  C#  

Capturing Performance Counter Data for a Process by Process Id

$
0
0

The .NET PerformanceCounter class generally is pretty easy to use in order to retrieve performance information. You create a perf counter, initialize the first value to read, let some time pass and then read the next value and Windows gives you access to a plethora of performance information. It’s nice what’s available to make that happen.

Process Specific Performance Counters

On several occasions, however, I’ve had a need to profile Process specific performance counters. For example, I need to look at a specific running application and display its CPU usage similar to the way Process Manager does. At first glance that seems easy enough as you can simply request a PerformanceCounter for a process by its name.

Here’s the simple code to do this (I’m using Chrome as my instance I’m profiling here):

var perfCounter = new PerformanceCounter("Process", "% Processor Time", "chrome");// Initialize to start capturingperfCounter.NextValue();for (int i = 0; i < 20; i++)
{// give some time to accumulate dataThread.Sleep(1000);float cpu = perfCounter.NextValue()/Environment.ProcessorCount;Console.WriteLine("Chrome CPU: " + cpu);
}

This works and gets me the active CPU status for Chrome.

When I run the above code, I get output that looks something like this:

ProcessCpuOutput

PerfCounters work by specifying Category (Process) and a key (% Processor Time) to create a counter. Once you have a counter instance you need to ‘start’ it collecting data, which you can do by calling NextSample() or NextValue(). This sets the counter to collecting data until the next call to NextValue() is fired at which time a value can be retrieved and provide an average for the time period measured. Typically you need to allow for a good chunk of time between the initial collection and the value collection so you get a reasonable sample period for Windows to collect the perf data. Here I’m using Thread.Sleep() but in an application you can possibly have the perf counter running on a background thread.

I’m collecting CPU data, which is provided as a percentage value. Note that the data is spread out over all the cores of the machine. This is why once I get the value I have to divide by Environment.ProcessorCount to get a value that resembles what’s displayed in task manager. This doesn’t quite make sense to me as single threaded code typically doesn’t spread across all cores, but it seems to be the same behavior that task manager and process explorer use. It’s also the guidance that Microsoft provides themselves.

The code above looks like it works fine collecting data and looking at task. But do you see a problem with this code especially in light of profiling Chrome which uses multiple process with the same name?

Eenie meenie miney mo – which Process has to go?

I used Chrome as my profiling target and the problem is that there are more than one instance of Chrome running. Check out task manager -even though I only have a single browser instance open, each tab inside of the browser runs as its own executable. In Process Explorer there are many instances of Chrome running and I have really no idea which one I was specifically monitoring.

MultiProcesses

The PerformanceCounter API has an annoying limitation – you can specify only a process name! It would be much more useful if you could actually specify a process ID rather than a process name, but well, that would be too easy.

Getting a Process Specific Performance Counter

It turns out there are a few workarounds for this. Essentially there’s a special performance counter API that lets you enumerate all processes and another that gives you an ‘Instance Name’. Specifically there’s the PerformanceCounterCategory class which allows you to retrieve a full list of ‘instance’ names for running processes. This list has unique IDs for each process and if there are multiple processes they are referenced like this:

chrome
chrome#1
chrome#2
chrome#3

and so on.

You can iterate over this list and match the Process ID from the PerfCounter returned and based on that get the InstanceName. You can then use these unique names to pass to the PerformanceCounter Process instance instead of the Process Name to get at a specific process for profiling information. And yeah, the code to do this is kind of ugly and can be also be very slow depending on how you handle it.

When I ran into this initially I found a number of Stackoverflow references as well as a post that shows a partial solution. But all of them were either incorrect (missing instances) or very slow (iterating over all objects) or require an explict process name – none of which worked for what I need this functionality for.

I’m working on a monitoring application that specifically monitors a group of processes and needs to display all of their CPU load characteristics in addition to other process data like memory and uptime.

It took a while of tweaking to get the code correct to include all instances, and to perform adequately. Specifically the instance lookup and looping through instances to find the process ID can be excruciatingly slow especially if you don’t filter the list of process names.

In the end I created a small reusable class that provides a more performant version:

public class ProcessCpuCounter{public static PerformanceCounter GetPerfCounterForProcessId(int processId, string processCounterName = "% Processor Time")
    {string instance = GetInstanceNameForProcessId(processId);if (string.IsNullOrEmpty(instance))return null;return new PerformanceCounter("Process", processCounterName, instance);
    }public static string GetInstanceNameForProcessId(int processId)
    {var process = Process.GetProcessById(processId);string processName = Path.GetFileNameWithoutExtension(process.ProcessName);PerformanceCounterCategory cat = new PerformanceCounterCategory("Process");string[] instances = cat.GetInstanceNames()
            .Where(inst => inst.StartsWith(processName))
            .ToArray();foreach (string instance in instances)
        {using (PerformanceCounter cnt = new PerformanceCounter("Process","ID Process", instance, true))
            {int val = (int)cnt.RawValue;if (val == processId)
                {return instance;
                }
            }
        }return null;
    }
}
There are two static methods here, with the GetPerfCounterForProcessId() being the high level one that returns you a full perf counter instance. The useful stuff relevant to this discussion however is the GetInstanceNameForProcessId() which receives only a Process Id and then spits back a normalized instance name – ie. Chrome, Chrome#1, Chrome#2 etc.

The slight optimization that results in significant performance improvements over the other samples is the filter for the process name so that new perf counter instances are only created for matching process names, not against all processes. On my machine I have 180 processes running and the process access was excruciatingly slow. By filtering down to only hit those names that match performance drastically improved. Note also that I’m not passing in a process name, but rather do a Process lookup using the Process class to get the name. Process returns the full file name but the Process Perf API expects just the file stem, so the extension is stripped by the code.

Trying it out

To check out this class I can now create a small test program that shows me the CPU load of all Chrome instances running:

// grab all Chrome process instancesvar processes = Process.GetProcessesByName("chrome");for (int i = 0; i < 10; i++)
{foreach (var p in processes)
    {var counter = ProcessCpuCounter.GetPerfCounterForProcessId(p.Id);// start capturingcounter.NextValue();Thread.Sleep(200);var cpu = counter.NextValue()/(float) Environment.ProcessorCount;Console.WriteLine(counter.InstanceName + " -  Cpu: " + cpu );
    }

}

Console.WriteLine("Any key to exit...");Console.Read();

The code basically runs in a dumb loop for 10 times and on each pass it goes through all the chrome instances and collects the perf data for each instance displaying the instance name (Chrome, Chrome#1, Chrome#2 etc.) and the current CPU usage.

Here’s what it looks like:

ChromeOutput

Performance is decent – there’s still a good deal of overhead on start up for the first time. As the Performance Counter API initializes apparently there’s a bit of overhead. But after the initial delay, performance is pretty swift.

Workey, Workey

I was able to plug this code into my process monitoring Web application that needed to display server status for a number of application servers running on the backend. I’m basically monitoring the worker processes for an admin summary page as well as for notifications if the CPU load goes into the 80%+ range. It works well.

This is another kind of obscure topic, but when you need to do per process monitoring I hope this article will come in handy to some of you…

© Rick Strahl, West Wind Technologies, 2005-2014
Posted in .NET  Windows  C#  

Chrome DevTools Debugging Issues

$
0
0

Since the last few Chrome releases have come out (v38 as of this writing), I’ve had some major issues with debugging not working properly. The behavior I see is pretty strange but it’s repeatable across different installations, so I thought I’d describe it here and then link it to a bug report.

What’s happening is that I have had many instances where the debugger is stopping on a breakpoint or debugger; statement, but is not actually showing the source code. I can see the debugger is stopping because the black screen pops up and I can see the play button in the debugger window.

What’s odd is that it works and the debugger stops the first time after I start the browser. If I reload the page a second or third time though, the debugger still stops, but doesn’t show the source line or even the right source file.

This is not an isolated instance either. I initially started seeing this issue with an Angular application, where the debugger would exhibit this same behavior in some situations, but not in others. Specifically it appeared the debugger worked in straight ‘page load’ type code – it stops and shows source code properly. But when setting a breakpoint inside of event code – an ng-click operation for example – the debugger again would stop, but not show the source code.

Example

So here’s a simple example from http://west-wind.com/websurge/features.aspx. I kept the script inline for keeping it simple, but whether the script is embedded or external really makes no difference to the behavior I see.

The page has a small bit of copied script in it that scrolls the page when you click one of the in page anchor links that navigate to hash tags that exist in the page. The code works now, but I initially had to make a few changes to make it work on my page from the original source.  Inside of jquery click handler I have the following code:

$("a[href*=#]:not([href=#])").on("click", function (e) {
   console.log('scrolling');   debugger;

Now when I do this on my local machine I get the following in Chrome 38:

ChromeDebugError

In this example, because it’s all one page the page at least is loaded, but when I had problems with my Angular app, the right source file wasn’t even opened.

Now if I hit the same exact page (just uploaded) on my live site I get the proper debugger functionality – but only on the first load. Reloading the page again after a restart I see the same behavior I see on localhost.

First load looks like this (correct behavior):

ChromeOnlineWorks 

But then subsequent requests fail again…

What I’ve Tried

My initial thought has been that there’s something wrong with my local Chrome installation, so I completely uninstalled Chrome, and Canary, rebooted and the reinstalled Chrome from scratch. But I got no relief from that exercise. I was hopeful that Chrome 38 which landed today (and replaced the generally messy 37 release) might help but unfortunately the problem persists.

I also disabled all plug-ins but given that my version on a remote machine worked with all plug-ins running makes me think it’s not the plug-ins.

Still thinking it might be something machine specific I fired up one of my dev VMs and tried checking out the code in there – and guess what same behavior. So it doesn’t look like this is a configuration issue in Chrome but some deeper bug with the source parsing engine.

I had also thought that with the Angular app earlier the problem might have been some issue with script parsing or map files, but even using non-minified scripts I ended up with the same issue.

I also experimented with the breakpoint options in the browser’s source tab which lets you disable breakpoints from stopping. This had no effect, since it doesn’t appear this option affects debugger statements, only actual breakpoints set in the debugger itself.

Finally I tried the nuclear option: I ran the Chrome Software Removal Tool to completely nuke and reset my settings. It removes plug-ins, clears history and cookies, resets config: settings and otherwise completely resets Chrome. Other than plug-ins I don’t really have much in the way of customizations, so I didn’t think this would really help and sure enough it didn’t – the errant behavior continues.

Nasty Bug

This is an insidious bug – and it’s been plaguing me for a few weeks now. In this page this isn’t exactly a big deal but in a recent larger AngularJs app I was working on I constantly ran into this problem and it was bad enough I ended up switching to FireFox for all debugging purposes. FireFox and Firebug work fine (as do the IE DevTools) but I generally prefer running in Chrome because overall the tools are just a little easier to work with in my daily workflow, so I’d like to get to the bottom of this issue.

So my question is – has anybody else run into this weird problem where some pages are not debugging? Any ideas on what to else to try? I did submit an issue to Google – lets see if anything comes of that.

© Rick Strahl, West Wind Technologies, 2005-2014

A jquery-watch Plug-in for watching CSS styles and Attributes

$
0
0

webmonitorlogo_smallerA few years back I wrote a small jQuery plug-in used for monitoring changes to CSS styles of a DOM element. The plug-in allows for monitoring CSS styles and Attributes on an element and then getting notified if the monitored CSS style changed. This can be useful to sync up to objects or to take action when certain conditions are true after an element update.

The original plug-in worked, but was based on old APIs that have now been deprecated in some browsers. There’s always been a fallback to a very inefficient polling mechanism and that’s what unfortunately had now become the most common behavior.  Additionally some jQuery changes after 1.8.3 removed some browser detection features (don’t ask!) and that actually broke the code. In short the old plug-in – while working – was in serious need of an update. I needed to fix this plug-in for my own use as well as for reports from a few others using the code from the previous post.

As a result I spent a few hours today updating the plug-in and creating a new version of the jquery-watch plug-in. In the process I added a few features like the ability to monitor Attributes as well as CSS styles and moving the code over to a GitHub repository along with some better documentation and of course it now works with newer APIs that are supported by most browsers.

You can check out the code online at:

Here’s more about how the plug-in works and the underlying MutationObserver API it now uses.

MutationObserver to the Rescue

In the original plug-in I used DOMAttrModified and onpropertychange to detect changes. DOMAttrModified looked promising at the time and Mozilla had it implemented in Mozilla browsers. The API was supposed to become more widely used, and instead the individual DOM mutation events became marked as obsolete – it never worked in WebKit. Likewise Internet Explorer had onpropertychange forever in old versions of IE. However, with the advent of IE 9 and later onpropertychange disappeared from Standards mode and is no longer available.

Luckily though there’s now a more general purpose API using the MutationObserver object which brings together the functionality of a number of the older mutation events in a single API that can be hooked up to an element. Current versions of modern browsers all support MutationObserver – Chrome, Mozilla, IE 11 (not 10 or earlier though!), Safari and mobile Safari all work with it, which is great.

The MutationObserver API lets you monitor elements for changes on the element, in it’s body and in child elements and from my testing this interface here on both desktop and mobile devices it looks like it’s pretty efficient with events being picked instantaneously even on moderately complex pages/elements.

Here’s what the base syntax looks like to use MutationObserver:

var element = document.getElementById("Notebox");var observer = new MutationObserver(observerChanges);
observer.observe(element, {
    attributes: true,
    subtree: opt.watchChildren,
    childList: opt.watchChildren,
    characterData: true});/// when you're done observingobserver.disconnect();function observerChanges(mutationRecord, mutationObserver) {
    console.log(mutationRecord);
}

You create a MutationObserver instance and pass a callback handler function that is called when a mutation event occurs. You then call the .observe() method to actually start monitoring events. Note that you should store away the MutationObserver instance somewhere where you can access it later to call the .disconnect() method to unload the observer. This turns out is pretty important as you need to also watch for recursive events and need to unhook and rehook the observer potentially in the callback function. More on the later when I get back to the plug-in.

Note that you can specify what you want to look at. You can look at the current element’s attributes, the character content as well as the DOM subtree so you can actually detect child element changes as well. If you’re only interested in the actual element itself be sure to set childlist and subtree to false to avoid the extra overhead of receiving events for children.

The callback function receives a mutationRecord and an instance of the mutation observer itself. The mutationRecord is the interesting part as it contains information about what was modified in the element or subtree. You can receive multiple records in a single call which occurs if multiple changes are made to the same attribute or DOM operation.

Here’s what the Mutation record looks like:

ModifiedRecord

You can see that you that you get information about whether the actual element was changed via the attributeName or you check for added and removed nodes in child elements. In the example above I used code to make a change to the Class element – twice. I did a jQuery .removeClass(), followed by an addClass(), which triggered these two mutation records.

Note that you don’t have to look at the actual mutation record itself and you can use the MutationObserver merely as a mechanism that something has changed. In the jquery-watch plug-in I’m about to describe, the plug-in keeps track of the properties we’re interested in and it simply reads the properties from the DOM when a change is detected and acts upon that. While  a little less efficient it makes for much simpler code and more control over what you’re looking for.

Adapting the jquery-watch plug-in

So the updated version of the jquery-watch plug-in now uses the MutationObserver API with a fallback to setInterval() polling for events. The plug-in syntax has also changed a little to pass an options object instead of a bunch of parameters that were passed before in order to allow for additional options. So if you’re updating from an older version make sure you check your calls to this plug-in and adjust for the new parameter signature.

First add a reference to jQuery and the plug-in into your page:

<script src="//ajax.googleapis.com/ajax/libs/jquery/1.11.1/jquery.min.js"></script><script src="scripts/jquery-watch.js"></script>

Then simply call the .watch() method on a jQuery selector:

// hook up the watcher$("#notebox").watch({// specify CSS styles or attribute names to monitorproperties: "top,left,opacity,attr_class",// callback function when a change is detectedcallback: function(data, i) {var propChanged = data.props[i];var newValue = data.vals[i];var el = this;var el$ = $(this);// do what you need based on changes
        // or do your own checks}
});

The two required option parameters are shown here: A comma delimited list of CSS styles or Attribute names. Attribute names need to be prefixed with a attr_ as in attr_class or attr_src etc. You also need to give a callback function that receives notifications when a change event is raised. The callback is called whenever one of the specified properties changes. The callback function receives a data object and an index. The data object contains .props and .vals arrays, which hold properties monitored and the value that was just captured. The index is the index into these arrays for the property that triggered the change event in the first place. The this pointer, is scoped to the element that initiated the change event – the element jQuery-watch is watching.

Note that you don’t have to do anything with the parameters – in fact I typically don’t. I usually only care to be notified and then check other values to see what I need to adjust, or just set a number of values in batch.

A quick Example – Shadowing and Element

Let’s look at a silly example that nevertheless demonstrates the functionality nicely. Assume that I have two boxes on the screen and I want to link them together so that when I move one the other moves as well. I also want to detect changes to a couple of other states. I want to know when the opacity changes for example for a fade out/in so that both boxes can simultaneously fade. I also want to track the display style so if the box is closed via code the shadow goes away as well. Finally to demonstrate attribute monitoring, I also want to track changes to the CSS classes assigned to the element so I might want to monitor the class attribute.

Let’s look at the example in detail. There are a couple of div boxes on a page:

<div class="container"><div id="notebox" class="notebox"><p>This is the master window. Go ahead drag me around and close me!</p><p>The shadow window should follow me around and close/fade when I do.</p><p>There's also a timer, that fires and alternates a CSS class every
            3 seconds.</p></div><div id="shadow" class="shadow"><p>I'm the Shadow Window!</p><p>I'm shadowing the Master Window.</p><p>I'm a copy cat</p><p>I do as I'm told.</p></div></div>

#notebox is the master and #shadow is the slave that mimics the behavior in the master.

Here’s the page code to hook up the monitoring:

var el = $("#notebox");

el.draggable().closable();

// Update a CSS Class on a 3 sec timervar state = false; setInterval(function () { $("#notebox") .removeClass("class_true") .removeClass("class_false") .addClass("class_" + state); state = !state; }, 3000);// *** Now hook up CSS and Class watch operationel.watch({ properties: "top,left,opacity,display,attr_class", callback: watchShadow });// this is the handler function that responds // to the events. Passes in: // data.props[], data.vals[] and an index for active itemfunction watchShadow(data, i) { // you can capture which attribute has changedvar propChanged = data.props[i];var valChanged = data.vals[i]; showStatus(" Changed Property: " + propChanged +" - New Value: " + valChanged);// element affected is 'this' #notebox in this casevar el = $(this);var sh = $("#shadow");

// get master current positionvar pos = el.position();var w = el.outerWidth();var h = el.outerHeight();// and update shadow accordinglysh.css({ width: w, height: h, left: pos.left + w + 4, top: pos.top, display: el.css("display"), opacity: el.css("opacity") });// Class attribute is more tricky since there are // multiple classes on the parent - we have to explicitly // check for class existance and assignsh.removeClass("class_true") .removeClass("class_false");if (el.hasClass("class_true")) sh.addClass("class_true"); }

The code starts out making the #notebox draggable and closable using some helper routines in ww.jquery.js. This lets us test changing position and closing the #notebox so we can trigger change events. The code also sets up a recurring 3 second switch of a CSS class in the setInterval() code.

Then the actual $().watch() call is made to start observing various properties:

el.watch({
    properties: "top,left,opacity,display,attr_class",
    callback: watchShadow
});

This sets up monitoring for 4 CSS styles, and one attribute. Top and left are for location tracking, opacity handles the fading and display the visibility. attr_class (notice the attr_ prefix for an attribute) is used to be notified when the CSS class is changed every 3 seconds. We also provide a function delegate that is called when any of these properties change specifically the watchShadow function in the example.

watchShadow accepts two parameters – data and an index. data contains props[] and vals[] arrays and the index points at the items that caused this change notification to trigger. Notice that I assign the propChanges and newValue variables, but they are actually not used which is actually quite common. Rather I treat the code here as a mere notification and then update the #shadow object based on the current state of #notebox.

When you run the sample, you’ll find that the #shadow box moves with #notebox as it is dragged, fades and hides when #notebox fades, and adjusts its CSS class when the class changes in #notebox every 3 seconds. If you follow the code in watchShadow you can see how I simply recalculate the location and update the CSS class according to the state of the parent.

Note, you aren’t limited to simple operations like shadowing. You can pretty much do anything you like in this code block, such as detect a change and update a total somewhere completely different in a page.

The actual jquery-watch Plugin

Here’s the full source for the plug-in so you can skim and get an idea how it works (you can also look at the latest version on Github):

/// <reference path="jquery.js" />/*
jquery-watcher 
Version 1.11 - 10/27/2014
(c) 2014 Rick Strahl, West Wind Technologies 
www.west-wind.com

Licensed under MIT License
http://en.wikipedia.org/wiki/MIT_License
*/
(function ($, undefined) {
    $.fn.watch = function (options) {/// <summary>
        /// Allows you to monitor changes in a specific/// CSS property of an element by polling the value./// when the value changes a function is called./// The function called is called in the context/// of the selected element (ie. this)///
        /// Uses the MutationObserver API of the DOM and/// falls back to setInterval to poll for changes/// for non-compliant browsers (pre IE 11)/// </summary>            
        /// <param name="options" type="Object">
        /// Option to set - see comments in code below./// </param>        
        /// <returns type="jQuery" /> var opt = $.extend({// CSS styles or Attributes to monitor as comma delimited list
            // For attributes use a attr_ prefix
            // Example: "top,left,opacity,attr_class"properties: null,// interval for 'manual polling' (IE 10 and older)            interval: 100,// a unique id for this watcher instanceid: "_watcher",// flag to determine whether child elements are watched            watchChildren: false,// Callback function if not passed in callback parameter   callback: null}, options);return this.each(function () {var el = this;var el$ = $(this);var fnc = function (mRec, mObs) {
                __watcher.call(el, opt.id, mRec, mObs);
            };var data = {
                id: opt.id,
                props: opt.properties.split(','),
                vals: [opt.properties.split(',').length],
                func: opt.callback, // user functionfnc: fnc, // __watcher internalorigProps: opt.properties,
                interval: opt.interval,
                intervalId: null};// store initial props and values$.each(data.props, function(i) {if (data.props[i].startsWith('attr_'))
                    data.vals[i] = el$.attr(data.props[i].replace('attr_',''));elsedata.vals[i] = el$.css(data.props[i]);
            });

            el$.data(opt.id, data);

            hookChange(el$, opt.id, data);
        });

        function hookChange(element$, id, data) {
            element$.each(function () {var el$ = $(this);if (window.MutationObserver) {var observer = el$.data('__watcherObserver');if (observer == null) {
                        observer = new MutationObserver(data.fnc);
                        el$.data('__watcherObserver', observer);
                    }
                    observer.observe(this, {
                        attributes: true,
                        subtree: opt.watchChildren,
                        childList: opt.watchChildren,
                        characterData: true});
                } elsedata.intervalId = setInterval(data.fnc, interval);
            });
        }function __watcher(id,mRec,mObs) {var el$ = $(this);var w = el$.data(id);if (!w) return;var el = this;if (!w.func)return;var changed = false;var i = 0;for (i; i < w.props.length; i++) {var key = w.props[i];var newVal = "";if (key.startsWith('attr_'))
                    newVal = el$.attr(key.replace('attr_', ''));elsenewVal = el$.css(key);if (newVal == undefined)continue;if (w.vals[i] != newVal) {
                    w.vals[i] = newVal;
                    changed = true;break;
                }
            }if (changed) {// unbind to avoid recursive eventsel$.unwatch(id);// call the user handlerw.func.call(el, w, i, mRec, mObs);// rebind the eventshookChange(el$, id, w);
            }
        }
    }
    $.fn.unwatch = function (id) {this.each(function () {var el = $(this);var data = el.data(id);try {if (window.MutationObserver) {var observer = el.data("__watcherObserver");if (observer) {
                        observer.disconnect();
                        el.removeData("__watcherObserver");
                    }
                } elseclearInterval(data.intervalId);
            }// ignore if element was already unboundcatch (e) {
            }
        });return this;
    }
    String.prototype.startsWith = function (sub) {if (sub === null || sub === undefined) return false;        return sub == this.substr(0, sub.length);
    }
})(jQuery, undefined);

There are a few interesting things to discuss about this code. First off, as mentioned at the outset the key feature here is the use of the MutationObserver API which makes the fast and efficient monitoring of DOM elements possible. The hookChange() function is responsible for hooking up the observer and storing a copy of it on the actual DOM element so we can reference it later to remove the observer in the .unwatch() function.

For older browsers there’s the fallback to the nasty setInterval() code which simply fires a check at a specified interval. As you might expect this is not very efficient as the properties constantly have to be checked whether there are changes or not. Without a notification an interval is all we can do here. Luckily it looks like this is now limited to IE 10 and earlier for now which is not quite optimal but at least functional on those browser. IE 8 would still work with onPropertyChange but I decided not to care about IE 8 any longer. IE9 and 10 don’t have onPropertyChange event any longer so setInterval() is the only way to go there unfortunately.

Another thing I want to point out is that the __watcher() function which is the internal callback that gets called when a change occurs. It fires on all mutation event notifications and then figures out whether something we are monitoring has changed. If it is it forwards the call to your handler function.

Notice that there’s code like this:

if (changed) {// unbind to avoid event recursionel$.unwatch(id);// call the user handlerw.func.call(el, w, i);// rebind the events   hookChange(el$, id, w);
}

This might seem a bit strange – why am I unhooking the handler before making the callback call? This code removes the MutationObserver or setInterval() for the duration of the callback to your event handler.

The reason for this is that if you make changes inside of the callback that effect the monitored element new events are fired which in turn fire events again on the next iteration and so on. That’s a quick way to an endless loop that will completely lock up your browser instance (try it – remove the unwatch/hookchange calls and click the hide/show buttons that fade out – BOOM!).  By unwatching and rehooking the observer this problem can be mostly avoided.

Because of this unwatch behavior, if you do need to trigger other update events through your watcher, you can use setTimeout() to delay those change operations until after the callback has completed. Think long and hard about this though as it’s very easy to get this wrong and end up with browser deadlock. This makes sense only if you act on specific property changes and setting other properties rather than using a global update routine as my sample code above does.

Watch on

I’m glad I found the time to fix this plugin and in the process make it work much better than before. Using the MutationObserver provides a much smoother experience than the previous implementations – presumably this API has been optimized better than DOMAttrModified and onpropertychange were, and more importantly you can control what you want to listen for with the ability to only listen for changes on the actual element.

This is not the kind of component you need very frequently, but if you do – it’s very useful to have. I hope some of you will find this as useful as I have in the past…

Resources

© Rick Strahl, West Wind Technologies, 2005-2014
Posted in JavaScript  jQuery  HTML5  

AngularJs and Promises with the $http Service

$
0
0

When using the $http service with Angular I’ve often wondered why the $http service opts to use a custom Promise instance that has extension methods for .success() and .error(). rather than relying on the more standard .then() function to handle the callbacks. Traditional promises (using the $q Service in Angular) have a .then() function to provide a continuation on success or failure, and .then() receives parameters for a success and failure callback. The various $http.XXXX functions however, typically use the .success() and .error() functions to handle callbacks. Underneath the $http callbacks there is still a $q Promise, but the extension functions abstract away some of the ugliness that is internal to the $http service.

This might explain that when looking at samples of Angular code that use the $http service inside of custom services, I often see code that creates a new wrapper Promise and returns that back to the caller rather than the original $http Promise.

The idea is simple enough – you want to create a service that captures the data and stores is and then notify the controller that the data has changed or refreshed. Let’s look at a few different approaches to help us understand how the $http service works with its custom promises.

Let’s look at a simple example (also on Plunker). Assume you have a small HTML block with an ng-repeat that displays some data:

<div class="container" ng-controller="albumsController as view" style="padding: 20px;"><ul class="list-group"><li class="list-group-item" ng-repeat="album in view.albums">{{album.albumName}} <i class="">{{album.year}}</i></ul></div> 

You then implement a service to get the data via $http and a controller that can use the data that the service provides.

The Verbose Way

Let’s start with the more complex verbose way of creating an extra promise which seems to be a commonly used pattern I’ve seen in a number of examples (including a number of online training courses). I want to start with this because it nicely describes the common usage pattern for creating custom Promises in JavaScript.

Here’s what this looks like in an factory Angular service implementation:

app.factory('albumService', ['$http', '$q'],function albumService($http, $q) {// interfacevar service = {
            albums: [],
            getAlbums: getAlbums
        };return service;// implementationfunction getAlbums() {var def = $q.defer();return $http.get("./albums.ms")
                .success(function(data) {
                    service.albums = data;def.resolve(data);
                })
                .error(function() {def.reject("Failed to get albums");
                });return def.promise;
        }
    });

The code in getAlbums() creates an initial Deferred object using $q.defer(). Then the $http.get() is called and when the initial $http callback returns either .resolve() or .reject() is called on the deferred instance. When – later on in the future – the HTTP call returns it triggers the Deferred to fire its continuation callbacks to the success or failure operations on whoever is listening to the promise on the promise .then()  function. Before the callback comes back though the at this point unresolved Promise is first returned back to the caller which in this case is the controller  that’s calling this service function.

The calling controller can now capture the service result by attaching to the resulting promise like this:

app.controller('albumsController', ['$scope', 'albumService',function albumsController($scope, albumService) {var vm = this;
        vm.albums = [];

        vm.getAlbums = function() {
            albumService.getAlbums().then(function(albums) {
                    vm.albums = albums;
                    console.log('albums returned to controller.');
                },function(data) {
                    console.log('albums retrieval failed.')
                });
        };
        vm.getAlbums();
    }
]);

Now when the HTTP call succeeds (or fails), it come back to the $http.get().success or error functions which in turn triggers the wrapper Promise, which then in turn fires the .then() in the controller with either result data (success) or an http error object (error).

When you run this, the Controller’s view .albums property is updated, which is in turn causes the list of albums to render in the browser.

Sweet it works. But – the use of the extra deferred is code that you can do without in most cases.

$http functions already return Promises

The $http functions  already return a Promise object themselves. This means there’s really very little need to create a new deferred and pass the associated promise back, much less having to handle the resolving and rejecting code as part of your service logic. Using the extra Promise to me would make sense only if you actually need to return something different than what the $http call is returning and you can’t chain the promise.

Promises can be chained, meaning you can have multiple listeners on a single Promise. So the service is one listener as it handles its .success and .error calls, but you can also pass that promise back to the caller and it can also receive a callback on that same Promise – after the service callback has fired.

Using the raw $http Promise as a result, the previous service getAlbums() function could be re-written a bit simpler like this:

function getAlbumsSimple() {return $http.get("albums.js")
        .success(function(data) {
            service.albums = data;
        });
}

This code simply captures the data from the service which is the albums JSON collection and assigns it to the service properties. The actual result from the call is a Promise instance and that is returned. Notice that the service here doesn’t handle any errors – that’s actually deferred to the client which may have to display some error information in the UI. If you wanted to pre-process error information you’d implement the error handler here and set something like an object on the service.

The controller can now consume this service method simply like this:

vm.getAlbumsSimple = function() {
    albumService.getAlbumsSimple()        .success(function(albums) {            
            vm.albums = albums;
            console.log('albums returned to controller.', vm.albums);
        })
        .error(function() {
            console.log('albums retrieval failed.');
        });
};

using the same familiar .success() and .error() functions that are used on the original $http functions.

The code is similar to the original .then() Controller example, except that you are using .success() and .error() instead of .then(). This provides the albums collection to the .success() callback and we our albums assigned it works just fine.

This works because promises can be chained and have multiple listeners. Promises are guaranteed that the callbacks are called in the order that they are attached and so the service function gets the first crack,  and then the controller function gets called after that. Both get notified and both can now respond off the single Promise instance.

However, the downside of this approach is that you have to know that the service is returning you an $http promise that has .success() and .error() functions which is kind of … non-standard.

What about $http.XXX.then()?

You can also still use the .then() function on an $http.XXX function call, but the behavior changes slightly from the original call. Here’s is the same controller code written with the .then() function:

vm.getAlbumsSimple = function() {
    albumService.getAlbumsSimple()
        .then(function (httpData) {vm.albums = httpData.data;},function(httpData) {
            console.log('albums retrieval failed.');
        });
};

Unfortunately the .then() function receives a somewhat different parameter signature than the .success and .error calls do. Now a top level data object is returned in the success callback of .then() and the actual result data that is attached to the .data property of that object. The object also contains other information about the $http request.

Here’s what the actual object looks like:

$httpThen

The object holds some HTTP request data like the headers, status code and status text, which is useful on failures. And it has a .data member that holds the actual request data that you’re interested in. Hence you need to do:

vm.albums = httpData.data;

inside of the .then() callback to get at the data. This is not quite what you’d expect and I suspect one of the reasons why so many people use a wrapper promise to hide this complex object and return the data directly as part of the wrapper Promise .then() call.

$http.then() Error Callback

When using .then() with an $http call and when an error occurs you get the same object returned to you, but now the data member contains the raw HTTP response from the server rather than parsed result data. Here’s the httpData object from the error callback function parameter:

$httpThenError

It’s nice that the error callback returns the raw HTTP response – if you’re calling a REST service and it returns a 500 error result, but also a valid error JSON response you can potentially take action and parse the error into something that’s usable on the client. That’s a nice touch.

$http.error() Callback

Since we’re speaking of error callbacks lets also look at the .error() callback parameters. The error callback has a completely different parameter and object layout than the .then() error callback which is unfortunate. Here’s an example of the signature in the $http.XXX.error() function:

albumService.getAlbumsSimple()
    .success(function(httpData) {        vm.albums = httpData.data;    })    .error(function (http, status, fnc, httpObj ) {        
        console.log('albums retrieval failed.',http,status,httpObj);
    });

The error callback receives parameters for the full HTTP response, a status code, and an http object that looks like this:

$httpError

Seems pretty crazy that the Angular team chose a completely different parameter signature on this error function compared to .then(). The signature here is similar to jQuery’s and I suspect that’s why this was done, although the httpObj has its own custom structure. Essentially it looks like the .then() method should be considered an internal function with .success() and .error() being the public interface. Again very unfortunate as this breaks the typical expectation of promises that use .then() for code continuation and expect a single data result object on success calls.

To be fair though the data that is contained in these result parameters is very complete and it does allow you build good error messages assuming the server returns decent error information in the right (JSON) format for you to do something with. Inconsistent - yes, but at least it’s complete!

$http Inconsistency

I find it a bit frustrating that Angular chose to create the $http methods with custom Promises that are in effect behaving differently than stock promises. By implementing .success() and .error() $http is effectively hiding some of the underlying details of the raw promise that is fired on the HTTP request. Even worse is that .then() is essentially behaving like an internal function rather than the public interface. Clearly the intent by the Angular team was to have consumers use .success() and .error() rather than .then().

This behavior provides some additional abilities to do this but it seems very counter intuitive and inconsistent. It seems like it would have been a much better choice to allow the .then() method to work the same as .success() and .error() with the same parameter signatures and adding extra parameters for the additional data that might be needed internally. Or even not have .success() and .error() altogether and have .then() just return the same values that those methods return to be consistent with the way promises are used elsewhere in Angular and in JavaScript in general.

This inconsistency and the fact that the .then() data object exposes $http transport details likely explains why so many people are wrapping the $http promises into another promise in order to provide a consistent promise result returned to the caller so that your usage of promises is consistent in your application. It just seems this would have been nice to do at the actual framework level in the first place.

Summary

Personally I’ve resigned myself to simply forwarding the $http generated Promises and using .success() and .error() at the cost of a little bit of inconsistency. At this point I have to know that this particular call in my service returns an $http promise, and that I need to call the .success() and .error() functions on it rather than .then() to handle the callbacks rather. But I still prefer that to wrapping my services with extra Promises. Regardless of where you push this behavior, somewhere in the stack you end up having this inconsistenty where the difference between $http promises and stock Promises shows up – so I might as well push it up into the application layer and save some senseless coding to hide an implementation detail.

I definitely don’t like the alternative or wrapping every service $http call into a wrapper promise since that’s tedious and painful to read in the service and adds another indirection call to every service call. But I guess it depends how much you value consistency – maybe it’s worth it to you to have the extra layer but treat every Promise in your application the same way using .then() syntax.

I’ve written this up mainly to help me remember all the different ways that results and errors are returned – I have a feeling I’ll find myself coming back to this page frequently to ‘remember’. Hopefully some of you find this useful as well.

Resources

© Rick Strahl, West Wind Technologies, 2005-2014
Posted in Angular  JavaScript  

WebClient and GetWebResponse not firing on Async Requests

$
0
0

Here’s a little oddity I ran into today: When you’re using the good old simple WebClient class you can subclass WebClient and capture the HttpWebResponse object. This is useful because WebClient doesn’t expose any of the important HTTP results like Http status code or headers. WebClient is meant to be ultra basic, but by capturing the Response you actually get most of the features you need of a full HTTP client. The most important ones that you’ll typically want to look at are the Http Status code and the Response headers. WebClient is just a high level wrapper around HttpWebRequest/HttpWebResponse and using a couple of overrides you can actually capture both low level interfaces without having to resort to using HttpWebRequest/Response which is considerably more work to use.

Recently I needed to build a set of HTTP utilities because I had some problems with the all async HttpClient– specifically some thread abort exceptions that weren’t giving me any more info on the error – and I decided to just create a small wrapper to make JsonRequest calls.

As part of the implementation I subclassed WebClient like this in order to capture the HttpWebResponse object:

/// <summary>
/// Customized version of WebClient that provides access/// to the Response object so we can read result data /// from the Response./// </summary>internal class HttpUtilsWebClient : WebClient{internal HttpWebResponse Response { get; set; }protected override WebResponse GetWebResponse(WebRequest request)
    {
        Response = base.GetWebResponse(request) as HttpWebResponse;return Response;
    }
}

and then created some helper methods that wrap up a JsonRequest<T> routine that basically let you retrieve and convert Json (you can check out the full code for this on GitHub for the HttpUtils class in Westwind.Utilities.

public static TResultType JsonRequest<TResultType>(HttpRequestSettings settings)
{var client = new HttpUtilsWebClient();if (settings.Credentials != null)
        client.Credentials = settings.Credentials;if (settings.Proxy != null)
        client.Proxy = settings.Proxy;
    client.Headers.Add("Accept", "application/json");if (settings.Headers != null)
    {foreach (var header in settings.Headers)
        {
            client.Headers[header.Key] = header.Value;
        }
    }string jsonResult;if (settings.HttpVerb == "GET")
        jsonResult = client.DownloadString(settings.Url);else{if (!string.IsNullOrEmpty(settings.ContentType))
            client.Headers["Content-type"] = settings.ContentType;elseclient.Headers["Content-type"] = "application/json";if (!settings.IsRawData)
            settings.CapturedRequestContent = JsonSerializationUtils.Serialize(settings.Content, throwExceptions: true);elsesettings.CapturedRequestContent = settings.Content as string;

        jsonResult = client.UploadString(settings.Url, settings.HttpVerb, settings.CapturedRequestContent);

        if (jsonResult == null)return default(TResultType);
    }

    settings.CapturedResponseContent = jsonResult;
    settings.Response = client.Response;
            
    return (TResultType) JsonSerializationUtils.Deserialize(jsonResult, typeof (TResultType), true);
}

Inside of that code I basically create custom instance of the HttpUtilsWebClient and then capture the response when done, to pass back to the caller as part of a settings object that is passed in initially:

settings.Response = client.Response;

When running the standard synchronous version this works perfectly fine.

Using the above code I can do stuff like this:

[TestMethod]public void JsonRequestPostAsyncTest()
{var postSnippet = new CodeSnippet()
    {
        UserId = "Bogus",
        Code = "string.Format('Hello World, I will own you!');",
        Comment = "World domination imminent"};           var settings = new HttpRequestSettings()
    {
        Url = "http://codepaste.net/recent?format=json",
        Content = postSnippet,
        HttpVerb = "POST"};var snippets = HttpUtils.JsonRequest<List<CodeSnippet>>(settings);Assert.IsNotNull(snippets);Assert.IsTrue(settings.ResponseStatusCode == System.Net.HttpStatusCode.OK);Assert.IsTrue(snippets.Count > 0);Console.WriteLine(snippets.Count);Console.WriteLine(settings.CapturedRequestContent);Console.WriteLine();Console.WriteLine(settings.CapturedResponseContent);foreach (var snippet in snippets)
    {if (string.IsNullOrEmpty(snippet.Code))continue;Console.WriteLine(snippet.Code.Substring(0, Math.Min(snippet.Code.Length, 200)));Console.WriteLine("--");
    }
Console.WriteLine("Status Code: " + settings.Response.StatusCode);
foreach (var header in settings.Response.Headers) {Console.WriteLine(header + ": " + settings.Response.Headers[header.ToString()]); } }
Note that I can look at the Response object settings. I can get the HTTP status code and look at the settings.Response.Headers if I need to.

Async Fail?

I also created an async version which is pretty much identical to the sync version except for the async and await semantics (and note how it’s not so easy to reuse existing code unless you can factor the pieces in great detail so this method is practically a copy of the first):

public static async Task<TResultType> JsonRequestAsync<TResultType>(HttpRequestSettings settings)
{var client = new HttpUtilsWebClient();if (settings.Credentials != null)
        client.Credentials = settings.Credentials;if (settings.Proxy != null)
        client.Proxy = settings.Proxy;

    client.Headers.Add("Accept", "application/json");if (settings.Headers != null)
    {foreach (var header in settings.Headers)
        {
            client.Headers[header.Key] = header.Value;
        }
    }string jsonResult;if (settings.HttpVerb == "GET")
        jsonResult = await client.DownloadStringTaskAsync(settings.Url);                else{if (!string.IsNullOrEmpty(settings.ContentType))
            client.Headers["Content-type"] = settings.ContentType;elseclient.Headers["Content-type"] = "application/json";if (!settings.IsRawData)
            settings.CapturedRequestContent = JsonSerializationUtils.Serialize(settings.Content, throwExceptions: true);elsesettings.CapturedRequestContent = settings.Content as string;

        jsonResult = await client.UploadStringTaskAsync(settings.Url, settings.HttpVerb, settings.CapturedRequestContent);if (jsonResult == null)return default(TResultType);
    }

    settings.CapturedResponseContent = jsonResult;
    settings.Response = client.Response;

    return (TResultType) JsonSerializationUtils.Deserialize(jsonResult, typeof (TResultType), true);//return JsonConvert.Deserialize<TResultType>(jsonResult);}

The call to this method is the same except for the await keyword and Async method called:

var snippets = await HttpUtils.JsonRequestAsync<List<CodeSnippet>>(settings);

This works fine for the HTTP retrieval and parsing, but unfortunately you don’t get the settings.Response instance and therefore no access to the Http Status code or header. The test code from above fails when trying to read the Status code because .Response is null. Argh.

When you’re using the async versions of WebClient (like DownloadStringAsyncTask()) the Response object is never assigned because the overriden GetResponse() method is never fired in the overload as it is in the synchronous call for client.UploadStringAsyncTask().

It turns out that there’s another overload of GetWebResponse() (thanks to Damien Edwards for pointing that out and making me feel like I missed the obvious now :-)) that takes an IAsyncResult input. The reason I missed this originally is that I thought pertained to the ‘old’ async interfaces and so dismissed it. Only when Damien pointed it out did I give that overload a try – and it works!

The updated HttpUtilsWebClient looks like this:

public class HttpUtilsWebClient : WebClient{internal HttpWebResponse Response { get; set; }protected override WebResponse GetWebResponse(WebRequest request)
    {
        Response = base.GetWebResponse(request) as HttpWebResponse;return Response;
    }protected override WebResponse GetWebResponse(WebRequest request, System.IAsyncResult result)
    {
        Response = base.GetWebResponse(request, result) as HttpWebResponse;return Response;
    }
}

Now, with this code in place the async tests that access the Response object to get the Http Status code and access the Response HTTP headers work fine. Yay!

With Access to Response, WebClient becomes a lot more useful!

Getting access to the Response object makes WebClient a heck of a lot more useful above and beyond its simple interface. And its simple interface really is a bonus if you just need quick and dirty HTTP access in an app. And it’s just built into the standard .NET libraries – no additional dependencies required and it also works with pre-4.5 versions of .NET.

This is great for simple and easy HTTP access, but also for simple wrappers like the one I described above. Having a simple helper to make JSON calls, plus the ability to capture input and output data is going to make some testing and debugging scenarios much easier…

© Rick Strahl, West Wind Technologies, 2005-2014

Updating Assembly Redirects with NuGet

$
0
0

Here’s a little NuGet gem that  I didn’t know and just found out about today: You can get NuGet to explicitly re-write your reassembly redirects in your .config files based on the installed NuGet Packages in the project.

You can use the following command from the Package Manager console:

PM> Get-Project All | Add-BindingRedirect

This recreates all those assembly redirects that are defined in your web.config or app.config file for a solution and updates them to match the versions from the various packages that are installed in each project. IOW it refreshes the assembly redirects to the actually installed packages of each project.

Right on! This is something I run into quite frequently and this simple command fixes the problem easily!  If you want this to work for an individual project just remove the –all flag.

Thanks to @maartenballiauw and @tsimbalar who pointed out this command to me when I was griping on Twitter about mismatched assemblies after an update to the latest ASP.NET WebAPI and MVC packages in a couple of projects. If you get “Could not load file or assembly '<assembly>' or one of its dependencies.” errors when you know you have the package and assembly referenced in your project, you’re likely running into a problem related to assembly versioning and need assembly redirects. NuGet automatically creates redirects for you, but versions can get out of sync when projects with cyclical dependencies are upgraded in a single solution.

Maarten also wrote up a blog post on this and I don’t want to take away from Maartens’s post here, and instead just link you to that for a good deal more information:

Could not load file or assembly… NuGet Assembly Redirects

I thought it was important enough of a command to repost this here, since it’s a little known command that probably can benefit many people. I know it’s definitely a problem I run into a lot because I have a few component libraries that take dependencies on high level framework libraries that rev frequently, so it’s easy for things to get out of sync.

© Rick Strahl, West Wind Technologies, 2005-2014
Posted in .NET  NuGet  ASP.NET  

Creating multi-target NuGet Packages with vNext

$
0
0

One feature that is going to make it much easier to create multi-targeted NuGet packages is the ability of the vNext platform to package compiled code directly into NuGet packages. By default vNext applications don’t compile to disk but rather create source code in the AppCode folder. A running application  then reads this source code and compiles the code on the fly via Roslyn to execute it from memory.

However, if you build class libraries you can also optionally write out the result to disk, which creates a NuGet package. That’s cool all by itself, but what’s even nicer is the fact that you can create multiple build targets for different versions inside of that NuGet package. You can create output for vNext Full and Core and even standard .NET and PCL components – all from a single project!

It’s essentially very easy and natural to produce a NuGet package like this:

NuGetPackage

This package contains output for vNext Full CLR (aspnet50), vNext Core CLR (aspnetcore50) and the full .NET Runtime (net45).

If you’ve built multi-targeted assemblies and packages before you probably know how much of a pain this was in previous versions of .NET and Visual Studio. You either had to hack the MSBUILD process or else use separate projects, Solution build targets or separate solutions altogether to accomplish this. In vNext you can do this with a few simple project settings. You can simply build your project with output options turned on both from within Visual Studio or from the command line without using MsBuild (yay!) and produce a NuGet package as shown above.

That’s pretty awesome!

Creating a Project

As part of my exploration of vNext I’m in the process of moving a few of my helper libraries to vNext. This is turning out to be a challenge if you plan on supporting the Core CLR which has a fairly restricted feature set. The vast percentage of code works as is, but there’s also a fair bit – and some of it surprising - that doesn’t run as is. And there’s an awful lot of looking for packages and namespaces to get the features that I know that are there…

For initial testing I used my Westwind.Utilities library and just pulled out one of the classes – the StringUtils class. I used this one because it has very few system dependencies so I hoped it would just run as is even under vNext. Turns out it doesn’t – even this very basic class has a few pieces that don’t exist under vNext or at least not with the same signatures. Which makes it perfect for this example as I have a few methods I need to bracket out for Core CLR usage.

Setting up a Library Project

In order to set this up the first thing I did is create a new Class library project in Visual Studio.

NewClassLibraryProject

By default Visual Studio creates a project.json file with the two ASP.NET nNext targets (aspnet50 and aspnetcore50). In addition I explicitly added the .NET 4.5 target (net45) in project.json (which is actually what’s shown in the project above).

Here’s what project.json looks like:

{"version": "1.0.0-*","dependencies": { }, "frameworks": {"net45": {"dependencies": { } },"aspnet50": {"dependencies": { } }, "aspnetcore50": {"dependencies": {"System.Runtime": "4.0.20-beta-*", "System.IO": "4.0.10-beta-*", "System.Runtime.Extensions": "4.0.10-beta-*","System.Text.Encoding": "4.0.0-beta-*","System.Text.RegularExpressions": "4.0.0-beta-*","System.Linq": "4.0.0-beta-*","System.Reflection": "4.0.0-beta-*","System.Reflection.Extensions": "4.0.0-beta-*","System.Reflection.TypeExtensions": "4.0.0-beta-*","System.Threading.Thread": "4.0.0-beta-*","System.Threading.Tasks": "4.0.0-beta-*","System.Globalization": "4.0.0-beta-*","System.Resources.ResourceManager": "4.0.0-beta-*"} } } }

The three highlighted targets correspond to the References nodes in Visual Studio project and correspond to the 3 different build targets of the project.

Note that I also explicitly have to reference any of the BCL components I’m using in my component for the Core CLR  target.  The other two are getting these same components from GAC components of the full CLR so they don’t need these. Since I’m including a ‘classic’ .NET 4.5 target here I have to be careful of how I add references – all vNext references that apply to both vNext Core and Full CLR need to be explicitly assigned to their dependency nodes, while any dependencies of the the full .NET runtime needs to go in its dependency section.

If you target only the two vNext versions you can use the global dependency node for any shared components which is a lot less verbose.

Note that for the Core CLR I have to manually add all the little tiny packages for the BCL classes that used to live in mscorlib and system. I added these as I started tweaking my component – they aren’t there by default. The only default component is System.Runtime. While adding every little thing is a pain it does help with modularization where you get just what you ask for and nothing more. But to be honest I find it hard to believe that anything less than what I have above would ever not be used by either my own code or any referenced components (minus the regex maybe) so maybe this is just getting a little too granular.

If you’re building projects that use more high level components (like EntityFramework or the new ASP.NET MVC) you’ll find that most of the things you need to reference are already referenced by those higher level components, so some of this minute package referencing goes away. But if you’re writing a core component that has minimal non-system dependencies you’ll find your self doing the NuGet Package Hula!

To help with finding Packages and Namespaces you might find  http://packagesearch.azurewebsites.net  useful. Maintained by a Microsoft employee ( Glenn @condrong)  this tool lets you search for packages and namespaces in the vNext BCL/FCL libraries by name:
packageSearch 

Conditional Code

Once you have your targets defined you can start adding some code. If your code just works across all the targets defined you’re done. Writing greenfield code it’s not too difficult to write code that works across all platforms.

In my case however, I was backporting an existing component and I ran into a few code references that didn’t work in the Core CLR.

If you have multiple targets defined in your application, vNext will compile your code to all 3 targets and shows you errors for any of the targets that fail. In my case I ran into problems with various System.IO classes like StreamWriter and MemoryStream that don’t exist (yet?) in vNext. In Visual Studio the compilation error window shows the errors along with the target that failed:

CompileErrors

Note the first 3 errors refer to StreamReader related errors. Apparently StreamReader doesn’t exist in vNext or I’m missing a package reference. I can see that the problem is in aspnetcore50 based on the project name in the Project column.

I can now also look at that code in the Visual Studio editor and see the StreamWriter reference error there for Core CLR along with an overview of the code I’m calling and which targets are supported and which ones won’t work (nice):

NoStreamWriter

It’s a bit odd that StreamWriter is not working. In fact most of the stream related classes in System.IO don’t appear to be there. It makes  me think that either I’m missing a package or this is still under heavy construction by Microsoft. Either way it demonstrates the point that there may be things that may not work with Core CLR.

To get around this I can now choose to bracket that code like this effectively removing this function (or alternately rewrite the function using some other code). For now I’m just going to bracket out the offending method altogether like this (with a //TODO to come back to it later):

#if !ASPNETCORE50/// <summary>
        /// Simple Logging method that allows quickly writing a string to a file/// </summary>
        /// <param name="output"></param>
        /// <param name="filename"></param>public static void LogString(string output, string filename)
        {            StreamWriter Writer = File.AppendText(filename);
            Writer.WriteLine(DateTime.Now.ToString() + " - " + output);
            Writer.Close();
        }#endif

If I then recompile or pack the project, I’ll get no errors.

The compiler constants available for the three target versions in this project are: ASPNET50,ASPNETCORE50,NET45. Each of these #define constants are implicitly created as upper case versions of the defined frameworks in project.json. You can use either of these to take particular action or bracket code for compilation.

Using the Component in another Project (Source Code)

If I flip over to my Web project and want to now use my component I can simply add a NuGet reference to it like this:

"dependencies": {"Microsoft.AspNet.Hosting": "1.0.0-beta2-*","Microsoft.AspNet.Server.WebListener": "1.0.0-beta2-*","Microsoft.AspNet.Server.IIS": "1.0.0-beta2-*","EntityFramework": "7.0.0-beta2-*","EntityFramework.SqlServer": "7.0.0-beta2-*","Microsoft.Framework.ConfigurationModel.Json": "1.0.0-beta2-*","Microsoft.AspNet.Mvc": "6.0.0-beta2-*",    "AlbumViewerBusiness": "" 
"Westwind.Utilities": "",},

Once added I can now use in code just like any other package. When this Web project uses this ‘project reference’ it pulls the source code for the Westwind.Utilities and compiles it on the fly and executes it.

I can also get the same Runtime version information from IntelliSense that tells me whether a feature is supported for one of the versions I’m targeting in the Web project. My Web project targets vNext Full and Core CLR so if I try to use the StringUtils.LogString() method I get this:

LibraryNoSupportedMethod

You can see here that LogString is available for Full CLR operation, but not for Core CLR operation and IntelliSense lets you know. The compiler too will let you know that if you use LogString and targeting the Core CLR you will get an error.

As you can imagine bracketing code out is not always a good idea – it makes it much harder to reuse existing code or migrate code. But it’s quite common as you can see by the heavy refactoring that’s happening in the core BCL/FCL libraries that Microsoft is reworking and the many missing features that just aren’t there (yet?).

Building a NuGet Package

When I built my project above I simply use the default build operation which doesn’t actually generate any output. By default vNext runs the code directly from source code and compiles it into memory. In vNext the compiler acts more as a syntax checker than an actual compiler when you click the Build button in Visual Studio.

You can however force the compiler to generate output to disk by setting an option which creates – you guessed it – a NuGet package rather than just an assembly. If I go back to the Westwind.Utilities project now and click on the Project Properties I can get this option (which is very likely to get a lot more options for package creation):

buildOutput

Now if I build the project I get my NuGet package built:

NuGetPackage

I can now take that package and either publish it or share it as needed. Before publishing I could also go in and customize the nupkg using the NuGet Package Explorer:

 PackageExplorer

Note that the current Package Explorer doesn’t understand the new vNext runtime versions yet, but that’ll change and hopefully Microsoft will consider moving some of this functionality right into Visual Studio and the build dialog to edit and adjust the package meta data.

Packages made easy

Creating multi-targeted libraries is never easy, but these new features in vNext at least make it a lot easier to manage the process of building them from a single source code base without having to heavily tweak the build process – it just works out of the box.

© Rick Strahl, West Wind Technologies, 2005-2014
Posted in ASP.NET vNext  

Mixing $http Promises and $q Promises for cached Data

$
0
0

If you use $http Promises in your Angular services you may find that from time to time you need to return some data conditionally either based on an HTTP call, or from data that is cached. In pseudo code the idea is something like this from an Angular service (this code won’t work):

function getAlbums(noCache) {// if albums exist just returnif (!noCache && service.albums && service.albums.length > 0) return service.albums;
return $http.get("../api/albums/") .success(function (data) { service.albums = data; }) .error(onPageError); }

The idea is that if the data already exists, simply return the data, if it doesn’t go get it via an $http call and return the promise that calls you back when the data arrives.

Promise me

The problem with the above code is that you can’t return both straight data and a promise from the same method if you expect to handle the result data consistently in one place.

Most likely you’d want to write your controller method using code like this:

vm.getAlbums = function() {
    albumService.getAlbums() 
        .success(function(data) {
            vm.albums = data;
        })
        .error(function(err) {
            vm.errorMessage='albums not loaded');
        });            
}

The code is expecting a promise – or even more specifically an $http specific promise which is different than a standard $q promise that Angular uses. $http object promises have .success() and .error() methods in addition to the typical .then() method of standard promises. I’ve covered this topic in some detail a few weeks back in another blog post.

So in order to return a consistent result we should return an $http compatible promise. But because of the special nature of $http promises the following code that creates a promise and resolves it also doesn’t quite work:

function getAlbums(noCache) {// if albums exist just returnif (!noCache && service.albums && service.albums.length > 0) {var def = $q.defer();
        def.resolve(service.albums);        return def.promise;
    }return $http.get("../api/albums/")
        .success(function (data) {                    
            service.albums = data;                   
        })
        .error(onPageError);
}

While the code works in that it returns promise, any client that tries to hook up .success() and .error() handlers will also fail with this code. Even if the consumer decided to use .then() (which both $http and plain $q promises support) the values returned to the success and error handlers are different for the $q and $http callbacks.

So to get this to work properly you really have to return an $http compatible promise.

Some Helpers to make it Easier

Because this seems to be a common scenario that I run into, I created a couple of helpers to facilitate this scenario with a couple of helper functions that can fix up an existing deferred and/or create a new completed promise directly.

(function(undefined) {
    ww = {};var self;
    ww.angular = {// extends deferred with $http compatible .success and .error functions$httpDeferredExtender: function(deferred) {
            deferred.promise.success = function(fn) {
                deferred.promise.then(fn, null);return deferred.promise;
            }
            deferred.promise.error = function(fn) {
                deferred.promise.then(null, fn);return deferred.promise;
            }return deferred;
        },// creates a resolved/rejected promise from a value$httpPromiseFromValue: function($q, val, reject) {var def = $q.defer();if (reject)
                def.reject(val);elsedef.resolve(val);
            self.$httpDeferredExtender(def);return def.promise;
        }
    };
    self = ww.angular;
})();

.$httpDeferredExtender() takes an existing, traditional promise and turns it into an $http compatible promise, so that it has .success() and .error() methods to assign to.

Using this extender you can now get the code that manually creates a $q deferred, to work like this:

function getAlbums(noCache) {// if albums exist just returnif (!noCache && service.albums && service.albums.length > 0) {var def = $q.defer();
        def.resolve(service.albums);        ww.angular.$httpDeferredExtender(def);return def.promise;
    }return $http.get("../api/albums/")
        .success(function (data) {                    
            service.albums = data;                   
        })
        .error(onPageError);
}

It works, but there’s a slight downside to this approach. When both the success and error handlers are hooked up two separate promises are attached. Both are called because you can attach multiple handlers to a single promise but there’s a little bit of extra overhead for the extra mapping.

Moar Simpler

Because the most common scenario for this is to actually return a resolved (or rejected) promise, an even easier .$httpPromiseFromValue() helper allows me to simply create the promise directly inside of the helper which reduces the entire code to a single line:

function getAlbums(noCache) {if (!noCache && service.albums && service.albums.length > 0) return ww.angular.$httpPromiseFromValue($q, service.albums);return $http.get("../api/albums/")
        .success(function (data) {                    
            service.albums = data;                   
        })
        .error(onPageError);
}

This really makes it easy to return cached values consistently back to the client when the client code expects an $http based promise.

Related Resources

© Rick Strahl, West Wind Technologies, 2005-2014
Posted in Angular  JavaScript  

Gotcha: Entity Framework gets slow in long Iteration Loops

$
0
0

Thought I’d highlight a common problem I’ve run into a few times with a few of my customers using Entity Framework.

I spent some time today with a customer debugging a very, very slowly process using Entity Framework operation. The customer was running a long order processing task involving an order with a thousands of order items plus a boat load of child items. This task is pretty massive, but it was taking 6+ hours to complete. Yikes. Lots of items for sure, but there’s no reason this should take hours or even more than a few minutes.

Now some people are very quick to blame EF for bad performance and while there may be something to that in some situations, I find that very frequently a few minor adjustments in code can fix serious performance issues. This was one of those cases.

An Example of Large Order Processing

The issue for this customer dealt with processing very large Sales Orders that involves looking up customers and order ids as part of the initial pre-processing operations.  We’re using business objects in this scenario but the business objects essentially host an Entity Framework dbContext and use it for the business object methods.

In the code below the business objects are used to load up instances of orders and customers for roughly 16,000 sales orders (modified for EF specifics and removed some additional processing code after the load operations to keep the code relevant):

private void LoadOrderIDsToProcess()
{// contains an initialized dbContext instance dbContextBusOrder orderBO = new BusOrder();foreach (OrderIDsToProcess orderID in orderIDsToProcess)
    {//var order = orderBO.Load(orderID.OrderID); var order = orderBO.Context.Orders.FirstOrDefault(o=> o.OrderID == orderID.OrderID); 
        orderID.CustomerID = order.CustomerID; 
    }
    orderIDsToProcess.OrderBy(x => x.CustomerID);BusCustomer customerBO = new BusCustomer();foreach (OrderIDsToProcess orderID in orderIDsToProcess)
    {//var customer = customerBO.Load(orderID.CustomerID);var customer = customerBO.Context.Customers.FirstOrDefault(c=> c.CustomerID == orderID.CustomerID);if (customer == null)
            orderID.BillingTypeID = 0;else                                     orderID.BillingTypeID = customer.BillingTypeID ?? 0;
    }
}

The process basically creates a single business object/dbContext and then proceeds to iterate over each of the sales order items and collects the orderIDs. Then the same process is roughly repeated to collect all the customer ids from this single order that already lives in memory.

What happens is that processing starts fast, but then slowly starts slowing down getting slower and slower as the loop count goes up. By the time we get to the last few items in the second loop there’s up to a 4 second delay between each iteration of the loop.

The first thought we had is that this was slow because of SQL, but checking the SQL Profiler logs it was easy to see that the queries were operating in the nearly unmeasurable millisecond range even once the loop starts slowing down. We could see however that the interval between database queries was increasing drastically.

So what’s going on here?

Watch your DbContext and Change Tracking!

The problem here is Entity Framework’s Change tracking. The code performs 16,000+ SQL load operations and then loads those 16,000 result records into the active dbContext. At first this isn’t a problem – the first few hundred records go fast, but as the context accumulates more and more entities to track both memory usage goes up and EF ends up having to look through the list of objects already in memory before going out and grabbing the next record.

In short the problem is dbContext bloat. dbContext is meant to be used as a Unit of Work, which generally means small chunks of work and a few records in a context. In this case the context is getting bloated with a lot of records.

There are a few simple solutions to this problem:

  • Recreate the dbContext/Business object inside of the loop for each iteration
  • Turn off change tracking for the dbContext instance

Recreate the dbContext

The first thing I tried is to simply move the business object (and therefore the dbContext) instantiation inside of the loop in both operations:

foreach (OrderIDsToProcess orderID in orderIDsToProcess)
{BusOrder orderBO = new BusOrder();var order = orderBO.Context.Orders.FirstOrDefault(o=> o.OrderID == orderID.OrderID); 
    orderID.CustomerID = order.CustomerID; 
}

Immediately re-running those same 6+ hour queries reduced the processing time to a mere 2 minutes. Note some people are hesitant to create new instances of dbContext because it’s supposed to be slow. While the first instantiation of a large dbContext (like the one used here) can be very slow, subsequent instantiation is not. You should not be afraid to create multiple dbContexts or re-create an existing dbContext to provide isolation or clear out change state.

One other real issue with dbContext is that it has no way to clear out the change tree. Even after you call .SaveChanges() EF maintains the internal entities it has already loaded. There’s no way to release this other than creating a new instance. So if you’re dealing with operations in loops recreation makes good sense.

Turn of Change Tracking

If you know that the context you are using for an iterative process doesn’t need to actually write changes an even more effective way to speed up performance is to turn off change tracking on the context instance. The context’s Configuration object has a AutoDetectChangesEnabled property for just this use case.

Using this property I can now write the code like this:

// contains an initialized dbContext instance dbContextBusOrder orderBO = new BusOrder();orderBO.Context.Configuration.AutoDetectChangesEnabled = false;foreach (OrderIDsToProcess orderID in orderIDsToProcess)
{        var order = orderBO.Context.Orders.FirstOrDefault(o=> o.OrderID == orderID.OrderID); 
    orderID.CustomerID = order.CustomerID; 
}

Running with this code for both the order and customer iterations reduced the processing times even further to 40 seconds!  40 seconds from over 6+ hours – that’s quite an optimization for essentially adding or moving a single line of code!

Now there is a single context performing all those Load() operations, but because change tracking is off, EF doesn’t keep track of the change tree and all that tracking overhead that was the apparent problem in the slowdown is no longer an issue and the code is very fast.

As long as you know that you’re not updating data with the context, this is a good solution. If you do need to update data, then using the previous approach of re-creating the context for each iteration is the right choice. Either way make sure that you keep your dbContext as much as possible in the scope of a single data operation.

dbContext and Lifetime

Clearly this is an example where the lifetime of a dbContext is very important. I’m always surprised when I see guidance for Web applications  that insist on creating a per Request dbContext instance. A per request context seems like a terrible thing to me when you think of the dbContext as a unit of work. While per request context may make sense in a lot of situations, it’ll absolutely screw you for others if you are not careful. This is one of those cases.

Personally I like to control the lifetime of the dbContext and create and dispose it when I’m done with it keeping with the Unit of Work theme that dbContext is based on. Especially given that creating the context in recent versions of EF is not the big, heavy operation it once was in earlier versions it’s no longer a big deal to create new instances of a context when you need to clear out the state of the context for different operations. In most situations it’s not the request that should control the lifetime, but the business objects that work with the context to perform the business operations that should handle this.

A few Thoughts

It’s surprising how frequently I’ve run into the issue of dbContext change tracking bloat both in my own and in customer code. Even though I know about this issue it’s easy to get complacent and forget that there are a few rules you have to live by when using Entity Framework (or most ORMs for that matter). Certainly if you look at the original code I showed, at a glance it makes perfect sense to create a single instance of the context and reuse it for all data operations – why would you re-create it each time? Because that’s one of the rules for EF: Don’t let the context bloat too much or it will become unbearably slow!

© Rick Strahl, West Wind Technologies, 2005-2014
Posted in Entity Framework  

INSTALL_FAILED_VERSION_DOWNGRADE: Watch your Android App Version

$
0
0

I’ve been working on a Cordova app on a cheap Galaxy Tab for testing. After a lot of tweaking and finessing config settings and SDK pieces to install I finally managed to get my app to install, run and debug on the Android device using the Visual Studio Tools for Apache Cordova. It was a pain but I was glad I managed to at least get it to run…

Until this morning that is. After making some offline changes to the app and installing a software update on the device I ended up getting:

INSTALL_FAILED_VERSION_DOWNGRADE

when trying to run the Cordova project.

To make sure I dropped to the terminal to use the Cordova CLI to make sure it’s not the tooling screwing up but I found the same behavior. The project would compile but when the time comes to deploy to the device I kept getting this error:

FailureToLaunch

My first thought was of course that the problem was the software update. After some searches on StackOverFlow there were lots of suggestions for re-installing the USB drivers for the device and the SDKs – both of which I actually did, but that didn’t help.

Watch your Project’s Version Number!

It turns out the problem was that I changed the version number of my project – down.  I’d been running with the default version number of 1.0.0 and I decided today to flip the version number down to 0.1.0 since it’s a pre-release version.

Well, it appears that when you install a new package with a lower version number it doesn’t want to install on the device, at least for running development installs (not sure what happens from an app store but I think that would actually uninstall first anyway).

The solution was simple enough: I uninstalled the old app from the device and re-ran:

cordova run android

and this time the app deployed and fired up on the Galaxy Tab. The Visual Studio Attach operation also worked at that point.

Problem solved, with a relatively easy solution. But man did it take some time to track this down. Countless other issues related to this error message popped while searching for it, and sifting through all of them took a long time before arriving at this simple solution. A clearer error message would go a long way towards making this a lot easier.

© Rick Strahl, West Wind Technologies, 2005-2015
Posted in Cordova  

Using Cordova and Visual Studio to build iOS Mobile Apps

$
0
0

Last week I took a look at the Visual Studio Tools for Apache Cordova, which is currently available as a CTP preview. To be honest I didn’t have high hopes, given some disastrous presentations I’d recently seen on this toolset. However, I was pleasantly surprised when I actually took this toolset for a spin – it solves a real problem by providing a unified installer for the necessary SDKs and tools to support Android, Windows Phone and iOS, and provides a very well thought out development platform that builds on top of the already awesome Web tooling that Visual Studio provides. The highlight of these tools is the ability to easily debug Cordova applications using Web developer tools that are integrated directly in Visual Studio, allowing you to debug either the provided emulators and simulators, or debug actual attached live devices including iOS devices.

Cordova

For those of you that don’t know, Apache Cordova – also known as Adobe PhoneGap – hybrid mobile Web development technology that lets you use standard Web technologies to build mobile apps. Cordova works by providing a native device application that hosts a full screen Web browser control as well as tooling for building the app and getting it ready for deployment to a mobile device. As a developer you implement the Web interface using the same Web technologies you use for Web development: HTML5, CSS and JavaScript as well as any support libraries and frameworks you might be using. Cordova – or in this case the Visual Studio Cordova Tools – then can build the application for you into a mobile device specific package that can be deployed to an app store and run on a mobile device. Because HTML5 mobile APIs are severely lacking in consistency and browser support, Cordova also provides a JavaScript based plug-in API that allows it to interact with native hardware and device APIs so you get access to native features of most mobile devices using a common multi-platform compatible interface. There are over 600 plug-ins that interfaces that provide access to most mobile device features and you can build your own plug-ins against native APIs if necessary.

Why do you need Visual Studio Integration?

Cordova on its own does a pretty good job of letting you create projects and build them using command line tools. However, it’s your responsibility to collect all the SDKs and tools you need for each platform and set them up. On Windows you also can’t build an iOS app, which is supported only on Macs. Cordova on its own also doesn’t do anything for debugging your applications – it lets you build and run them on a device but there’s no debugging support.

The Visual Studio Tools for Apache Cordova provide a consolidated installation for all the necessary SDKs and emulators, as well as an integrated development experience from coding to running and debugging of a Cordova applications, all within the boundaries of Visual Studio. Additionally Cordova natively doesn’t allow for building iOS applications on Windows, but using the Visual Studio tools you can actually develop and debug iOS apps on Windows.

Here are some of the highlights of Visual Studio Tools for Apache Cordova:

  • Installation of all necessary SDKs for Windows Phone and Android on Windows
  • A remote iOS build and debugging agent that interfaces with XCode’s command line build tools
    (a Mac and Apple Developer Account is required to build and debug)
  • A startup template that sets up a multi-platform project (iOS/Android/Windows Phone)
  • Customized platform configuration integration
  • A host of Emulators you can run on Windows
  • Full DOM and CSS Viewer for live applications both in emulators and on devices
  • Full JavaScript Console and Debugger using the Visual Studio debugger UI

iOS support is Excellent

I’ve been particularly impressed by the iOS support, which allows you build, run and debug Cordova apps using Visual Studio and run on a live device attached to a Mac. While you still need to have a Mac somewhere on the network and an Apple Developer account to make this work, it’s still pretty impressive to click Attach in Visual Studio and have your app fire up on an actual live iPhone, and then provide you rich browser developer tools to let you interactively access a DOM and Style inspector, a JavaScript Console and use Visual Studio as a debugger.

Ironically the iOS support currently is better than either the Windows Phone or Android experience. Windows Phone/Windows Universal debugging is not yet supported and Android debugging requires devices running Android 4.4 or later.

I’ve toyed with Cordova in the past off and on, and I’ve always turned away from it because it was just too much of a pain trying to debug on device applications especially for iOS devices. Using these tools for Visual Studio however, it feels very natural to develop, test and debug your application either in a browser, an emulator or on an actual device.

Creating a Cordova Application for iOS

To take these tools for a spin I took a small AlbumViewer sample application and moved it to Cordova. I’m going to use iOS as the example here because iOS has traditionally been the most difficult platform for Windows developers to build mobile apps for and to me this is one of the highlights of the Visual Studio Tools for Apache Cordova. Other platforms are actually easier to set up, but currently there are limitations: Android 4.4 has to be used for live device debugging, and Windows Phone/Universal currently don’t support debugging at all, but the range of support is supposed to be better by the time these tools release.

Let’s get started. I’m using Visual Studio 2013 and the add-in package for the Cordova tools (CTP 3). You can also use the Visual Studio 2015 Preview which includes these tools as part of its installation although the template is available only with TypeScript there.

First step is to create a new project:

NewCordovaProject

This creates a new project that includes the various platform specific subfolders for various resources, plug-ins and merged components that Cordova internally uses to build a native application.

 VsProject

This project contains a bunch of stuff that’s mostly related to the 3 platforms that Visual Studio defaults to: Android, iOS and Windows Phone/Universal.

The key component in this project is the index.html page which is the application’s start page that Cordova launches when the mobile app starts. From there you can essentially launch your Web based application and go to town. The main difference is that the index.html references cordova.js and platformoverrides.js, which are platform specific, generated files that Cordova produces when it packages your app.

cordova.js is the gateway to Cordova’s platform specific integration features. Most importantly it’s the interface that provides the plug-in system which is used to extend raw browser behavior and allows third parties to expose native APIs as JavaScript APIs in your application. Plug-ins are meant to get around the shitty HTML5 mobile API support and provide a consistent platform for accessing hardware like the camera, microphone, haptic feedback, battery status, or access software APIs for things like access to the Camera Roll, the contacts, call list and SMS systems on devices. There are over 600 Cordova plug-ins available to date to allow you to integrate more closely with a device and the API is open so you can build your own extenders into any of the mobile device platforms supported.

The index.html file is the application’s entry point and essentially you are building a Web application. So anything you’d normally do with a Web application – display a start page and have logic in JavaScript files or hooking up a framework like Angular works as you’d expect.

The default index.html looks like this:

<!DOCTYPE html><html><head><meta charset="utf-8" /><title>AlbumViewerCordova</title><!-- AlbumViewerCordova references --><link href="css/index.css" rel="stylesheet" /></head><body><p>Hello, your application is ready!</p><!-- Cordova reference, this is added to your app when it's built. --><script src="cordova.js"></script><script src="scripts/platformOverrides.js"></script><script src="scripts/index.js"></script></body></html>

Notice the three script links which load the Cordova dependencies.

index.js serves as an entry point that exposes a few key lifetime events for a mobile app:

(function () {"use strict";

    document.addEventListener( 'deviceready', onDeviceReady.bind( this ), false );function onDeviceReady() {// Handle the Cordova pause and resume eventsdocument.addEventListener( 'pause', onPause.bind( this ), false );
        document.addEventListener( 'resume', onResume.bind( this ), false );// TODO: Cordova has been loaded. Perform any initialization that requires Cordova here.};function onPause() {// TODO: This application has been suspended. Save application state here.};function onResume() {// TODO: This application has been reactivated. Restore application state here.};
} )();

These are useful *if* you want to take special action when these events occur, but this matters only if you are depending on Cordova specific features in your app.

In the end what you are working with is just an HTML5 application, which means you should be able to use any application and just make it work.

Importing an existing Web App

To test this theory of how well an already running mobile aware Web app would translate to run with Cordova, I took a recent sample application – an AlbumViewer I created for another article – and ported it into Cordova. I’m going to spoil the suspense by telling you up front – it worked, and it worked with only a few modifications.

You can check out this sample app from this GitHub repository:

https://github.com/RickStrahl/CordovaAlbumViewer

Here’s a screen shot of the app running on an live iPhone.

AlbumViewer

And here’s the same app running on an iPad:

AlbumViewerIPad


So let’s take a look at the process involved in making this happen.

Remove external Dependencies – Using local Data

At this point I’ve created a new project and am starting from ground zero. This existing app originally worked against a local Web service (which was the main point of the previous article), so the first thing I wanted to do is remove the dependency on the service and switch to local data. The application is an Angular application and it uses services for the data access to the service to retrieve data.

Originally there was an AlbumsService and ArtistService to retrieve data. I ended up creating corresponding AlbumsServiceLocal and ArtistServiceLocal implementations that pulled the same data from local files and then stored them in local storage after that. The idea is that a mobile application should as much as possible use local data and access the Web mainly to sync. In this case I didn’t want to have the sample rely on having to set up a service locally so I kept the data all local.

I made these changes BEFORE I moved the code over to Cordova, because I figured it’d be easier to do in a pure Web environment. Turns out that’s not exactly true – I can actually set up Cordova to run my app the same way, but I didn’t figure that out until later :-) I’ll come back to that later when I talk about process a little.

Importing into the Project

Once I had the app running with local data and without other dependencies I decided to move it into the Cordova project. This is as easy as copying the files into the project wholesale. After I’ve imported the project now looks more like a typical Web project:

ImportedProject

The only file overwritten in this process is index.html which is the main startup page for my application that hosts the Angular ng-app layout and that is responsible for loading up all related script and style resources.

index.html is also the only file I had to initially change after copying – I had to add the three Cordova dependencies:

<script src="cordova.js"></script><script src="scripts/platformOverrides.js"></script><script src="scripts/index.js"></script>

And that’s all I changed initially.

Testing the App under Cordova

So far this isn’t impressive. All I’ve done is moved a Web project to a new folder. But now lets see how you can actually test out this application. Cordova comes with a host of different emulators and simulators. There are Web based emulators that provide basic functionality and there are the full fledged emulators that the various SDKs provide and of course you can run on an actual device.

For the initial test I’m going to use the Ripple Browser emulator for iOS that allows you to see your app running using Cordova and also gives you a first taste of the debugging experience.

To select an emulator select your target platform in the drop down next to the build target (Debug) list. Since I’m targeting iOS eventually I’ll use that. Then click on the drop down next to the Attach button to pick your emulator. I’ll pick the Ripple iPhone 5 emulator since that’s as close as I can get to my iPhone 6 I want to test with later.

Here’s what those options look like:

EmulatorSelection

Note that there are options for Remote Device which allows me later to run on my live phone, and various Simulators which are the Mac based iOS simulators from the Apple iOS SDK. You can use either of these only if you have an attached Mac and an Apple developer account. I’ll come back to that shortly. For now I’ll use Ripple.

To start up the app, click Attach… and go.

RippleDebug

When you run your application, Visual Studio launches the emulator and puts itself into Web DevTools mode. These Dev Tools look like the same Dev Tools that are in the latest versions of Internet Explorer, but note that I’m actually running the Ripple browser which actually runs in Chrome. So in effect I’m using the IE Dev Tools to debug Chrome. That’s… new and it works very well.

You have a live DOM Explorer (you can change things and reflect in the app!) and CSS Style Viewer as well as a full JavaScript console. Any console.log commands from your JavaScript code will show up in the Console as will errors and networks navigations etc. IOW, it behaves as you would expect browser Dev Tools to behave. The Ripple emulator is browser based and because it runs in Chrome you can also use the Chrome’s Dev Tools to debug the application, so you have a choice which browser tools you want to use.

The exciting thing here is that these Visual Studio based Dev Tools also work when you debug a native device as I’ll show in a minute.

So now we can get the app to run in a browser – ho hum. We know how to do that without Cordova. So let’s take a look to run this on a live iOS device.

Setting up for iOS Deployment

To build apps for iOS you’ll need a Mac and an Apple Developer account.

To be clear, I’m pretty green when it comes to using a Mac. Although I have a Mac Mini at home that I use for music recording and the occasional browser testing for Web applications, I generally don’t use the Mac much. When I do it feels like I’m going into a foreign country vacation… in general I’m mostly fumbling around when working on the Mac especially trying to figure out where things go when dealing with terminal related tasks.

However, given the tooling and instructions Microsoft provides, the installation of the remote build agent was straight forward. Although I ran into one snag I was able to get everything running on the Mac in the course of 15 minutes which is better than I’d expected.

Install Mac Applications

The first thing you have to do is install the tooling on the Mac, which involves manual installation of a few applications and some command line tools via Node Package Manager (NPM). The base documentation and links for this can be found here:

To summarize here’s what you need to install to get started. Install the following Mac applications:

You’ll also need:

  • An active iOS Developer Program Account

Install the Remote Build Agent

Next you need to install the actual Visual Studio Remote Build Agent. The install instructions are pretty simple. Open a command prompt on the Mac and run:

cd /usr/local
sudo npm install -g vs-mda-remote --user=Username

where Username is your Mac username.

The NPM installer installs HomeBrew (a package manager for the Mac if it isn’t installed already), and the XCode 6 Command Line tools as well as the actual Visual Studio Remote Tools for Cordova Build Agent. Unfortunately, for me these simple instructions did not work – I saw failures trying to install HomeBrew and I had to manually install it (http://brew.sh). Once HomeBrew was installed I re-ran the NPM install for the build agent and was able to get the remainder of the tools installed.

Set up a Linked Developer Account

You also need to make sure that XCode has a linked developer account which you can do by starting XCode and then going the XCode menu | Preferences | Accounts and linking a developer account. Follow the prompts to add your Apple developer account to the list of identities.

Firing up the Remote Build Agent

Once the tools are installed and you have a developer account set up, you can run the the VS Remote Build Agent from the Mac Terminal:

vs-mda-remote --secure false

This starts the build tools and listens for connections on port 3000.

Set up Visual Studio to use the Remote Build Agent

Next you have to configure Visual Studio so it can find the remote build agent on the Mac. You can do this via Tools | Options | Tools for Apache Cordova:

Figure 6 - iOS Remote Configuration

You specify the IP or host name for the Mac remote host, the port which defaults to 3000 and an optional security pin. I prefer to not use a pin and run the remote agent on the Mac with the –secure false flag. Unless network security is an issue for you I would recommend you don’t use a PIN as I found I had to frequently reset the PIN which turned into a real pain. If you do want to use PIN you can run vs-mda-remote generateClientCert to generate a new PIN, which is then displayed in the terminal window.

When done with the config  form in Visual Studio click OK. If you don’t get an error the remote agent was found and you’re ready for remote processing on the Mac.

Ready, Set… Run!

Make sure that the build agent is running on the Mac and an iOS device is attached and the screen unlocked anytime you plan on building or running your application on iOS. To run the application, open your Cordova project  in Visual Studio and make sure you select iOS as the platform, and Remote Device from the Attach drop down. Then click the actual Attach button to run the app and watch the magic.

When you hit the Attach button, Visual Studio communicates with the remote build agent on the Mac to push over the files to process.

VS Build Agent

The remote agent basically handles setting up a Cordova project on the Mac and then uses Cordova to compile and run the project on the device (or emulator). Cordova in turn uses the XCode command line tools to build the XCode project that it creates and get it deployed on the device to test.

For the first run this can take a couple of minutes as the project is set up for the first time in a temp folder on the Mac, but subsequent runs take about 15 seconds from hitting Attach to having the app active on my phone. Not bad at all. The app should now be running and behave just like a browser based app on the phone.

When the app comes up on my iPhone, Visual Studio also switches back into the DOM debugger, as shown earlier with the Ripple emulator. Same deal – I can see the DOM, active styles and the JavaScript console. The active document is live so I can make changes in the DOM Explorer and see them immediately reflected back on my iPhone! Likewise I can use the Console to echo back info from my app or actually change any global state.

Debugging an iOS App

If you want to debug, you can easily do that as well. Simply set a breakpoint in any of the source files and run the application. Here’s a breakpoint being hit when loading the list of artists:

VsDebugIOs

You can see that you get both the inline inspection (notice the dummy user agent code I put in to show it’s coming from the remote iPhone), as well as the Locals and Watch Windows and the Console Window view on the right where you can use use for example console.log(albums) to log out any values that are in scope to inspect – and edit – values in real time.

I don’t know about you, but I find this pretty impressive. Remotely debugging on the actual device is pretty sweet and to me at least has been one of the missing pieces in Cordova development before. Although you could always debug applications using plain browser tools or even the Ripple debugger, debugging actual behavior, styling/layout and the actual Cordova plug-ins in a live debug view is awesome. Big props to Microsoft for making this work and integrating the debugging experience so nicely into Visual Studio.

Debugging Gotcha: Startup Code debugging doesn’t work

Note: there’s a bit of a gotcha when it comes to debugging startup code. The Visual Studio debugger takes some time to get attached and so you can’t debug startup code and even some initial code like the first page loading. In the above example I’m stopping on event code, so that works but had I put code in the initial rendering of artists it wouldn’t have worked. If you do need to debug startup code you have let the page load and then somehow reload the index.html page after the debugger has been attached. You can add a button or link anywhere in the app (I have mine on the Settings page when I’m running in ‘developer mode’) that does: window.location.href='index.html'. This reloads the index.html page when the debugger is already attached and you can then debug any startup code.

Other Platforms

Android

You can get this same debugging experience I just described for iOS from Android (4.4 KitKat and later) devices attached to the local machine and if the devices are switched into developer mode and have USB debugging enabled. Note that older devices are not directly supported although I think if you install the appropriate SDKs and change a few environment variables you can make it work. I didn’t try. According to the docs v4.4 and later works. I tried running my app on a v4.4 Galaxy Tab 4 7” and the app ran without much of a problem – once I had the SDKs set up properly.

The Cordova Tools for Visual Studio install the Android SDK, but I had major issues getting the project to build initially. I found that several components that are required weren’t actually installed.  The following link has detailed information that worked once I double checked and installed all the required components that somehow the installer didn’t install:

Once the SDK was properly installed however I was able to step right in and run and debug my application on the Android Device.

Another oddity is that the Web site mentions a new, optimized Android emulator that’s supposed to install with these tools, but on my machine this emulator is nowhere to be found even though I have both Visual Studio 2015 (which also includes the Cordova tools) and the add-in package for VS2013. This seems like it would be a useful thing to have although I think having a live device ultimately is the better choice as it seems and much less resource intensive than actually loading into an emulator. In fact I picked up the Galaxy Pad for just this reason a while back. It’s not a great device (very slow and choppy especially when compared to the iPad), but it’s a good way to test on an ‘average’ Android device.

Windows Phone

Ironically Windows Phone and Windows Universal is the platform that currently has the least integration with these Visual Studio Cordova Tools. In this preview, you can’t debug on a live Windows Phone device or even the emulator. The docs mention that this is just for the current preview. I have a Nokia Lumia 920 and the app

Windows Phone and Angular Routing

Windows Phone required some special configuration to deal with IE mobile’s link fixups. Apparently Windows Phone browser considers hash-bang URLs with multiple segments suspect and marks them as unsecure:ms-appx:#/artist/2. This causes problems for Angular’s navigation and a pop up dialog that tries to download an application to handle this URL moniker.

The workaround for this is to let Angular know how to handle the ms-appx moniker, and essentially ignore the funky prefix and navigate it. You can use the following config override in app.js:

app.config(['$routeProvider','$compileProvider',function($routeProvider,$compileProvider) {// … Route Configuration

// Fix bug for Windows Phone wanting to download files on urls with routed parameters$compileProvider.aHrefSanitizationWhitelist(/^\s*(https?|ftp|file|ms-appx|x-wmapp0):/); }]);

As usual with anything Microsoft and browser related there are a lots of problems with getting the application to run on Windows Phone.  Here are a few of the problems I ran into:

  • The ms-appx prefix issue above
  • Bootstrap Modal is just MIA – not popping up just blank (not fixed)
  • FontAwesome fonts wouldn’t load until I explicitly remove cache busting query string
  • A number of buttons (not all though) just take multiple clicks before they navigate
  • I ended up turning off CSS transitions but when they were on they were ridiculously slow

Running as a pure Web App in your Browser

As a side note – you can also still run the app as a ‘pure’ browser app because a Cordova app is essentially a Web app plus some Cordova plug-in juju. If your app can run without the Cordova specific features you can debug it in the browser.  Since we’re essentially talking about Web applications here that typically have only very minor or no mobile integration that relies on plug-ins I find that I can actually be most productive developing and debugging using simply Chrome and the Chrome DevTools and then only occasionally test on the actual device.

To do this you can start a Web Server in the Cordova root folder and just open the index.html page. I like to use the the NPM installed http-server:

npm install http-server -g

then simply change to the folder of the app and run it:

cd c:\projects\CordovaAlbumViewer
http-server

which starts the server locally on port 8080 (which you can override with a command line switch). You could also use IIS Express started from the command line if you prefer.

When you run this way loading of the cordova.js file will fail (it’s not actually there) so any dependencies on plug-ins won’t work. However, anything else will work just fine inside of the browser.

Summary

These Visual Studio Tools for Apache Cordova are a very nice bit of tooling that’s going to make it much easier to build mobile Web applications and get them deployed into App stores.

Personally I believe that Web technology ultimately will win out over the crazy multi-platform development craze that we’re seeing now. It’s only a matter of time – but it’s just such a shame that W3C and HTML5 standards have let us down so much over the last few years to provide so little native mobile support in terms of mobile API access from Web browsers.

Cordova provides a bridge by combining a plug-in API that makes it possible to build the interfaces to native devices and expose that functionality. Looking at it with a cynical eye I would say that Cordova’s approach is much more useful than the stuck-in-the-mud mobile standards for HTML5. If only the mobile browsers would provide a similar model natively we could actually expect HTML5 evolve into a better mobile platform. But alas in the meantime Cordova provides that bridge to make it at least possible to build single code base mobile applications.

Microsoft’s tooling offers a very useful productivity boost on top of Cordova making the development process and more importantly the debugging process much more natural.

The Visual Studio Tools for Apache Cordova are currently in CTP state with an expected release timed to the release of Visual Studio 2015 later this year. You can install these tools either as a Visual Studio add-in package for Visual Studio 2013 or by downloading the Visual Studio 2015 Preview. Go to http://tinyurl.com/ptgkz6k to download the tools and start building mobile apps.

To find out a bit more about the Visual Studio Tools for Apache Cordova and this sample check out my forthcoming article in CODE Magazine that provides a bit more detail along with some additional discussion of gotchas and tweaks of the application discussed here. It’ll be in the March/April issue.

Resources

© Rick Strahl, West Wind Technologies, 2005-2015
Posted in Cordova  Visual Studio  Mobile  
Viewing all 665 articles
Browse latest View live